Bloomberg Terminal was introduced in 1981, long before Personal Computers and the Internet became ubiquitous. Since then, it has delivered fast access to financial analytics, crucial news, data, and trading tools, helping traders and investors turn knowledge into action.
For more than four decades, the Bloomberg Terminal has remained at the cutting edge of technology and innovation. It is now considered a modern icon of financial markets.
However, it still has some flaws. First of all, it is a very expensive tool, costing up to $24,000 annually per user. Second, it is not simple to use. You need to have some experience and business skills to understand the interface and data patterns.
For users who have just started and don’t want to pay the enormous price tag, there are plenty of cost-effective options available in the market.
Below, we have listed some of the best Bloomberg Terminal Alternatives that could be a great match for your requirements. We’ve selected them based on four factors: affordability, ease of use, value for money, and user ratings.

Did you know?
Many major financial institutions consider the Bloomberg Terminal essential infrastructure for trading, risk management, analytics, and communication. For instance, the Bank of England signed a multi-year contract worth over £15 million for its Terminals.
Table of Contents
9. Capital IQ
Price: Starts at $7,500 per user per year | Demo is available
User Ratings: 4.2/5
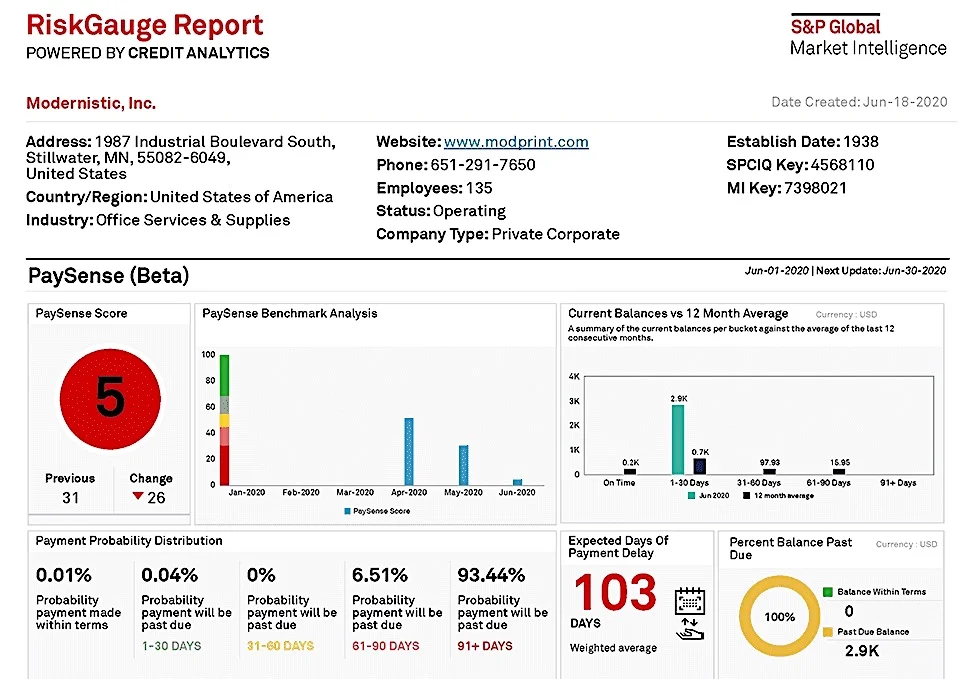
Capital IQ is a market intelligence platform developed by Standard & Poor’s (S&P). It provides research data and analytics on public and private businesses to help finance professionals make informed decisions.
Capital IQ offers a range of tools (including a web portal and mobile apps) to investment managers, institutions, corporations, banks, and advisory firms. These tools cover all complex investment structures, including hedge funds and mutual funds, providing analysts with up-to-date insights, performance comparisons, and fund strategies.
The platform gathers and analyzes over 135 billion data points, which include company profiles. Financial data, executive summaries, and independent analyst and risk reports.
According to S&P’s official website, Capital IQ covers financials for more than 88,000 publicly listed businesses, or 99% of global market capitalization.
Pros
- Comprehensive and customizable screening tool
- 30+ years of experience
- Covers over 2.5 million company executives and investment professionals
- Assess the credit risk of over 50 million public and private companies
Cons
- Software can be unwieldy on certain internet browsers
Its most popular tools (Xpressfeed, Compustat, and Money Market Directories) give you access to real-time market data, desktop research, backtesting, financial modeling, portfolio management, and quantitative analysis through web-based and Excel-based apps.
Another tool, RiskGauge, allows you to evaluate the credit risk of millions of companies based on their fundamentals, performance benchmarks, market signals, and macroeconomic statistics.
Perhaps the best thing about this platform is its ease of accessibility. Unlike the Bloomberg Terminal, which requires software installation on every machine, a Capital IQ account can be accessed from a web browser on any device.
8. AlphaSense

Price: Varies according to the number of team members | 2-week free trial available
User Ratings: 4.1/5
AlphaSense is a market intelligence search engine that utilizes artificial intelligence and machine learning algorithms to better understand different types of businesses. It analyzes both private and public companies and presents their information to expedite market and investment research.
The software gives you access to trade journals, Wall Street equity research, company documents, and call transcripts, among other crucial information.
You can apply advanced sentiment analysis to earnings transcripts to spot market-moving signals. The Smart Synonyms technology captures language variations and ensures you never miss a thing when analyzing performance reports, transcripts, news, and trade journals.
Pros
- Gives you access to premium business data sources
- Streamlines your research workflow
- AI-powered smart alerts
- Annotate, clip, and share research
Cons
- Sometimes it’s hard to find reports via keyword search — it returns too many random results.
AlphaSense has seen tremendous growth in recent years. It covers fillings, transcripts, presentations, and other high-value curated content from over 10,000 sources. Its services are used by more than 75% of the S&P 100 companies, 70% of the top asset management firms and consultancies, and all of the largest 20 pharmaceutical companies.
7. Sentieo
Price: Starts at $500 per month per user | Free trial available
User Ratings: 4.4/5
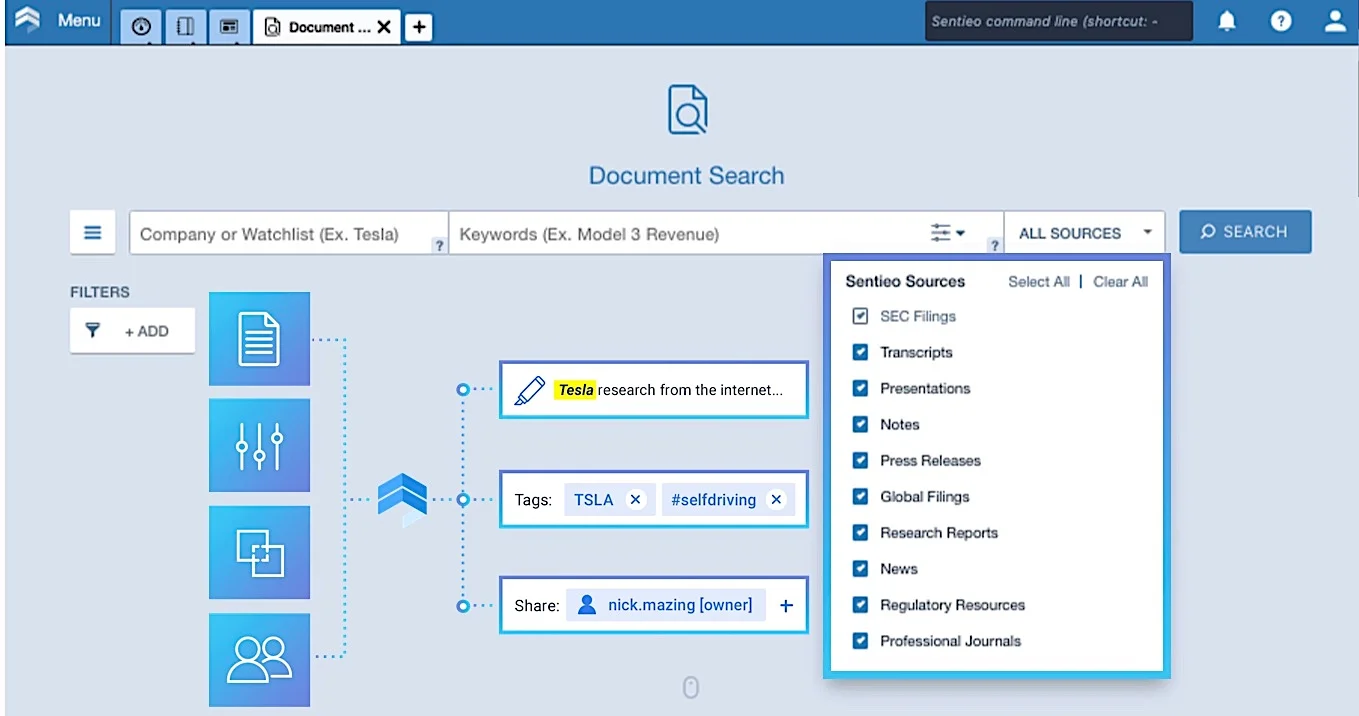
Sentieo is a financial and corporate research platform that brings together financial document search, data extraction and modeling, and research management. The integrated solution helps financial analysts make smarter decisions and execute winning strategies.
The Sentieo Equity Data Terminal, for example, streamlines the process of deep analysis and model-building. The AI-driven Document Search is optimized to provide financial data, documents, and business roles.
The NLP Smart Summary utilizes natural language processing to quickly spot changes in competitor strategies. It is smart enough to identify positive and negative sentiments across a set of peers or sectors.
Pros
- Screener to identify targets
- Plotter for data visualization and analysis
- AI-driven Document Search
- Excel Plugin for model building
Cons
- Financial data of some companies is not as robust as its competitors
All these tools save you significant time and empower you to take fast, decisive action ahead of the competition. Plus, the entire platform is cloud-based and mobile-friendly, so you can use it on all devices without installing any software.
Note: Sentieo is now a “part of AlphaSense”. With the acquisition, Sentieo’s technology (AI search, monitoring, extraction, summarisation) is integrated into AlphaSense’s platform
6. Finviz
Price: Free | Elite version costs $15 per month
User Ratings: 4.5/5
Finviz is one of the best stock screeners for both beginners and experts. Finviz stands for ‘financial visualizations,’ and it is known for its simple yet powerful tools.
Finviz’s Stock Screener searches through tens of thousands of stock data points and returns a group of stocks that match one or more selected criteria (called filters). It has three types of filters:
- Descriptive filters are the basic set of filters around exchanges, market capitalization, industry, dividend yield, etc.
- Fundamental filters provide detailed information on financial and derived ratios, allowing users to filter tickers by sales growth, P/E ratio, EPS growth, institutional ownership, and other fundamental metrics.
- Technical filters include volatility, moving averages, RSI, percentage change, etc.
You can increase your workflow by saving multiple filter combinations as presets.
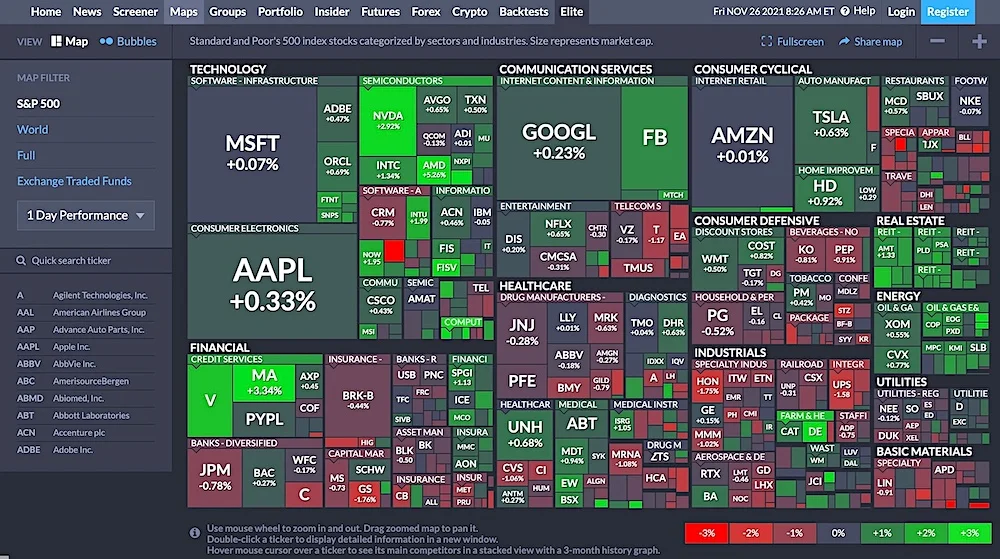
The platform also has heat maps for quick browsing and analysis of large volumes of market data. While it provides a broad overview of the market, you can customize it to view stock maps of a specific sector, exchange, industry, or country.
When you come across a stock or sector, you can conduct a more detailed analysis. Plus, you can convert heat maps into bubbles or square charts for a more personalized view.
Pros
- Full integration of fundamental and technical analysis
- Fast navigation, instant update
- Excellent map visualizations of stocks by sector
- Free version is sufficient for many swing traders
Cons
- No mobile application
- UI looks a bit outdated
Overall, Finviz is a great tool for traders and investors focused on the US markets. It does an excellent job of visualizing and summarizing valuable information in lists, maps, charts, and graphs.
5. Koyfin
Price: Basic plans start at $15 per month | Free version available
User Ratings: 4.1/5
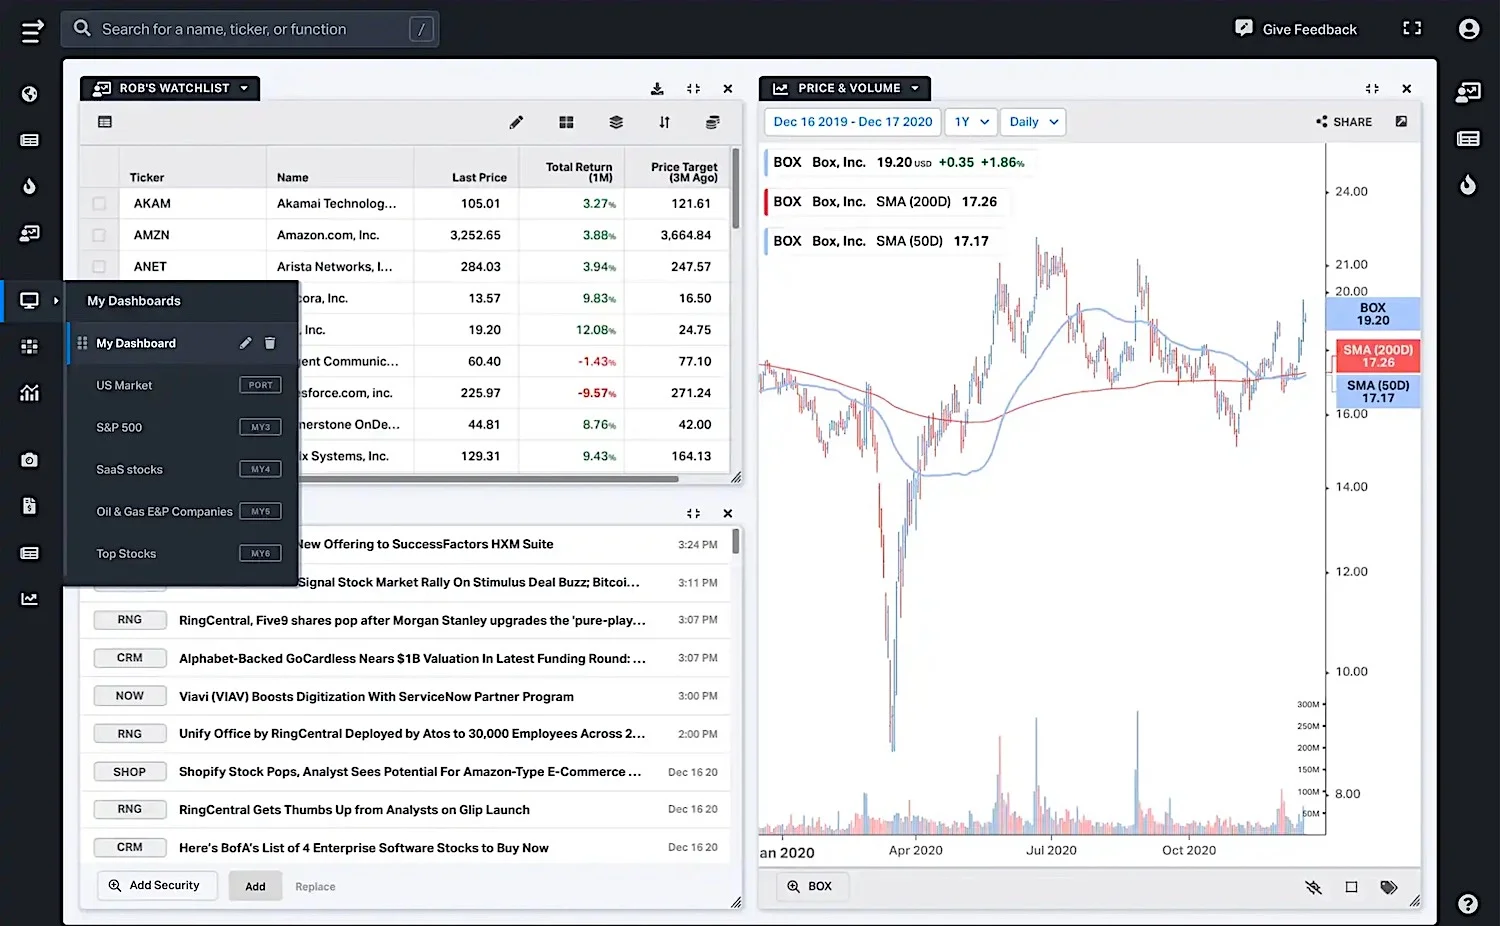
Koyfin is designed for self-directed active investors and fundamental-based swing traders. Its powerful research and visualization tools provide a comprehensive view of financial markets.
Koyfin was founded by two former Wall Street traders, Rob Koyfman and Rich Meatto. They developed all of the Koyfin graphing and analysis tools from scratch to make it easy for traders and investors to turn data into information.
Most of its features can be customized to meet your specific needs — from swing trading using your own capital to advising wealth management clients. You can plot information across different assets and tailor the price charts to your unique trading technique.
The visualization tool lets you customize graphs using hundreds of technical analysis indicators, create valuation metrics, and view price targets and earnings estimates. You can easily get detailed company snapshots, financial statements, and valuation analysis with the click of a mouse.
Pros
- Cloud-based platform with free analysis tools
- Configure charts with over 100 technical, fundamental, and valuation indicators
- Covers economic data on a country level
Cons
- No mobile application
- Limited technical analysis tools
Koyfin provides in-depth qualitative data and financial metrics that are worth your money. Some of the tools and data are as rich and ‘premium’ as what you would get in the Bloomberg Terminal for a higher price tag.
4. PitchBook
Price: Varies from $1,000 to $1,500 per month | Free trial available
User Ratings: 4.1/5
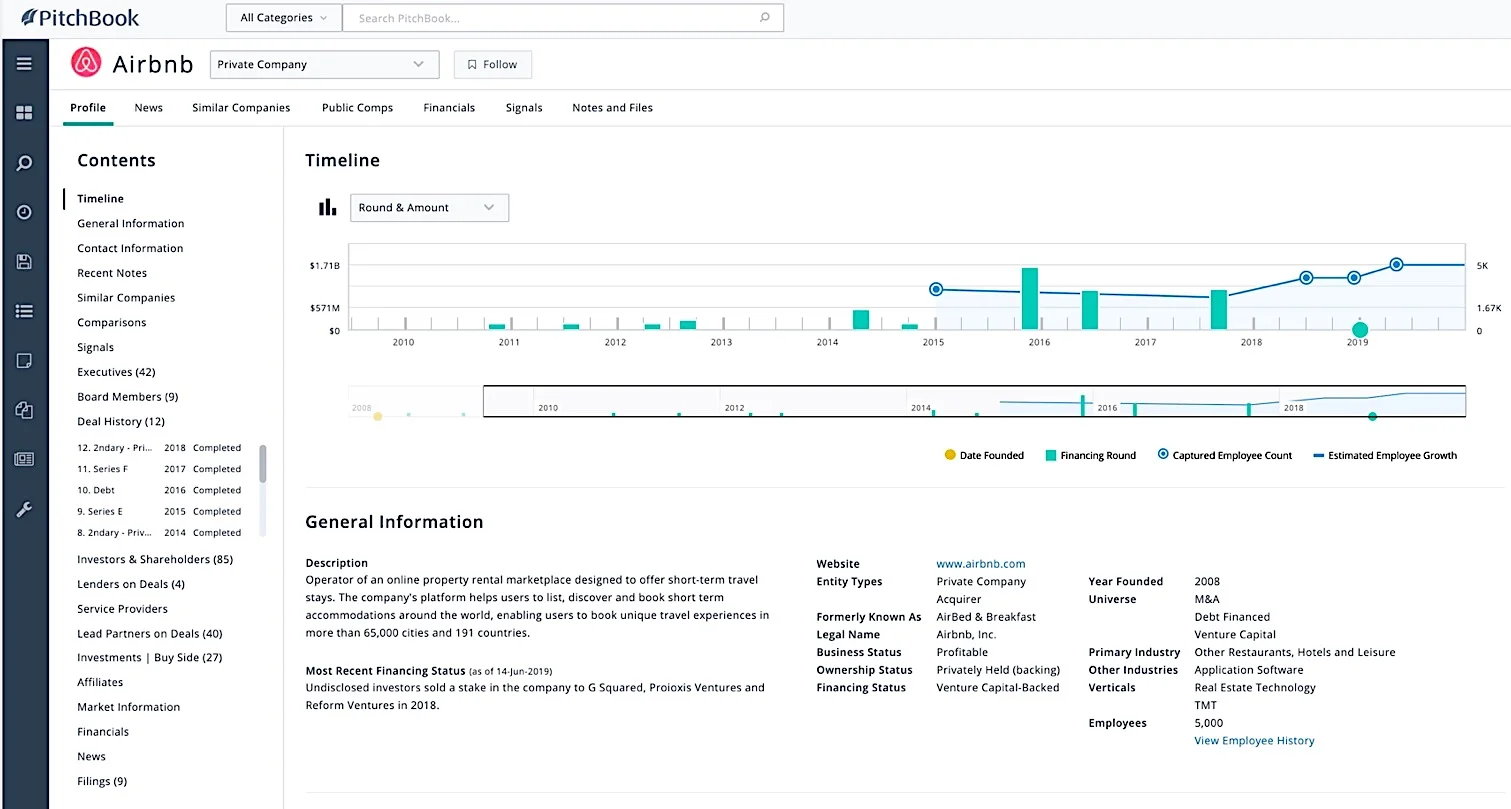
PitchBook gives you a comprehensive view of private capital markets, including private equity, venture capital, and M&A transactions. It covers more than 3.3 million companies, 1.5 million deals, 370,000 investors, and 74,000 funds.
Unlike other platforms that focus on a single region and track only a few parameters in each market, PitchBook tracks the full lifecycle of private firms worldwide, gathering data from multiple sources at every stage, from seed funding to secondaries.
It provides every detail of the business and its associated investors, including financing history, executive team, profit and loss statements, valuation and cap tables, and more.
You can set custom alerts to know if a new business pops up, top executives change jobs, or a competitor introduces a new product/service. The platform has plenty of tools, such as chart builders, benchmarks, pivot tables, and direct download options, so you quickly gain actionable insights from PitchBook’s datasets.
Pros
- Comprehensive database of private companies, venture capital, and M&A transactions
- Commentary and analysis of current events, trends
- Easy-to-navigate user interface
Cons
- Expensive for small firms
- Sometimes information is a little out of date
Plus, they have a great analyst team, composed of former investors, business operators, consultants, and buy-side and sell-side equity research analysts. They are all available to discuss the specifics of any research query and share hard-to-find details.
3. YCharts

Price: Starts at $200 per month | 7-day free trial available
User Ratings: 4.5/5
YCharts is a powerful, customizable tool that helps you build portfolios, analyze securities, and communicate investment opportunities. It also allows you to monitor key metrics, visualize hypothetical performance, and validate your investment strategies.
Unlike most other charting tools, YCharts supports visualization of a wide range of metrics, from alpha to z-score and everything in between. See price charts of a specific duration, overlay them with technical indicators, and compare securities to strengthen your investment plans.
The tool is packed with more than 40 technical indicators, such as price-based moving averages, RSI, MACD, and stochastic. Fundamental charts are available with more than 4,500 financial metrics and three decades’ worth of historical data, including revenues and profit and loss statements.
Using Fund Screener, you can filter mutual funds and ETFs based on expense ratio, fund flows, manager tenure, risk, and valuation metrics. You can also set limits on exposure to asset classes, geographic locations, and other parameters. There are some pre-built templates to provide a starting point for better fund selection.
Pros
- 4,500 financial metrics and 30 years of financial data available to chart
- 40+ pre-built templates for common stock
- 15 pre-built comparison tables and 20+ fund screens
- Customizable with firm colors and logo
Cons
- Basic plans offer very limited features
Founded in 2009, YCharts has truly democratized investment research. It is now used by thousands of investors, asset managers, and financial advisors. It has a client base of more than 6,500 asset managers and financial planners who oversee more than $800 billion in assets.
2. Refinitiv Eikon
Price: Starts at $3,600 per year
User Ratings: 4/5
Refinitiv Eikon comes with high-performance tools that deliver trusted content and analytics. Its powerful collaboration and messaging tools let you connect with authentic contacts at over 30,000 companies across 180 countries.
One of its most used tools — called Refinitiv Digest — gives you access to more than 10,000 relevant news providers, including content from Reuters. It is powered by artificial intelligence algorithms to provide you with a personalized briefing of information and news from all major global sources.
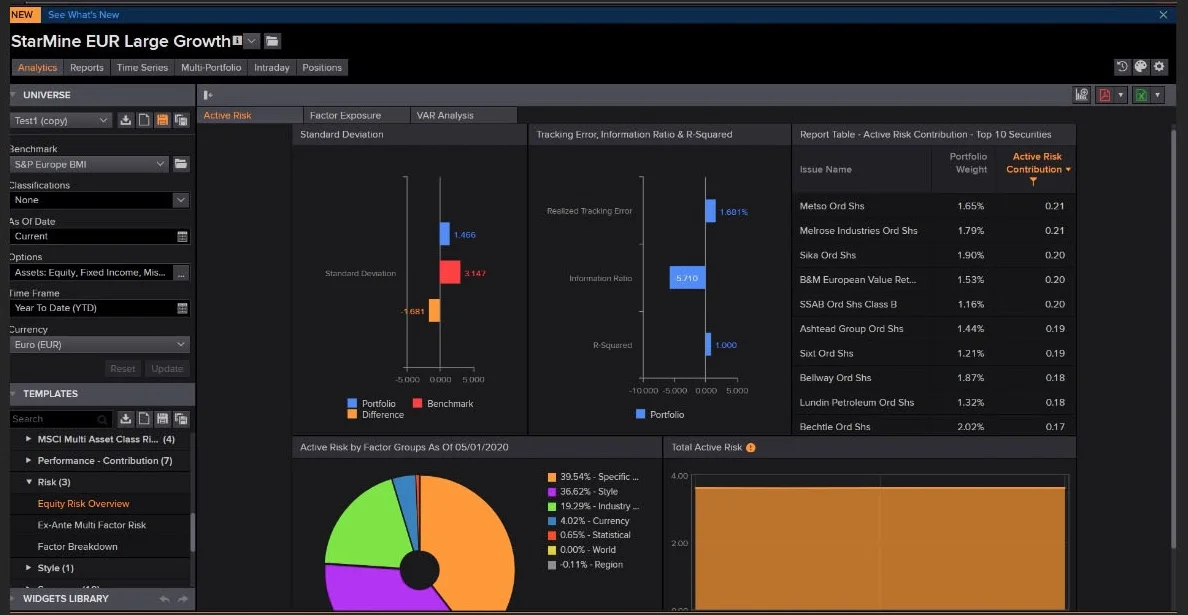
While Refinitiv Digest collects historical and real-time insights from thousands of sources, other unique tools such as MarketPsych and StarMine Analytics help you identify opportunities and make better predictions.
The Financial Chart app is integrated with search and other core functionality that help you quickly transform a large volume of data into a tide of opportunity. You can find competitive advantages and make portfolio decisions with confidence.
This multi-asset class solution covers fixed income, equities, currencies, mutual funds, ETFs, FX forwards, and listed futures and options positions. There is an option to set customized alerts on equities, mutual funds, and more, so you know when important news is released or prices change.
Pros
- Built on an open technology platform
- AI-curated briefing of news
- Forecasts and quantifies portfolio risk
- Customize alerts on stocks, hedge funds, FX, and more
Cons
- User interface can be a bit overwhelming at first
- Delisted companies’ data is not always available
And since Refinitiv Eikon is built on an open technology platform, you can control how information is consumed and used. More specifically, you can build and plug into various APIs and apps to get the data you need.
1. FactSet

Price: Annual membership costs about $12,000
User Ratings: 4.2/5
FactSet provides investment management solutions for financial advisors, asset owners, investment bankers, and traders. It is powered by superior analytics and flexible technology to help users identify and seize opportunities sooner.
The platform has everything you need to become a good trader, from detailed insights into public companies and comprehensive coverage of equity to fixed-income benchmarks and workflow solutions across the portfolio lifecycle.
It also offers enterprise risk solutions that help you monitor and analyze portfolio risk with forecast horizons spanning from long-term to short-term. You can easily decompose risks at a particular data point or analyze changes over time.
FactSet has more than 130,000 active users with an annual client retention rate standing at over 90%. The company continuously improves its technology and acquires smaller platforms to offer the best customer experience. Since 2000, they have made over 15 acquisitions, 7 of which have been content providers.
Pros
- Contains a plethora of organizational information
- Four decades of experience
- Effective risk analysis
- 90% customer retention rate
Cons
- Steep learning curve
FactSet has more than four decades of experience gathering and integrating data from over 1000 databases. Their customer support is top-notch. They have an excellent team of subject matter experts and technical specialists who patiently guide you through all of your problems.
Other Equally Good Bloomberg Terminal Alternatives
10. Atom Finance
Price: $7 per month | 7-day free trial available
User Ratings: 4.7/5
Atom Finance is developed with the aim of democratizing access to high-quality investment research resources. It is available for Android, iOS, and web.
This modern investment research platform is packed with several impressive features, such as historical financials, valuation metrics, SEC filings, detailed analyst consensus estimates, curated news, corporate events, and more.
Atom Finance tracks all your investments in one place, in real-time. It covers stocks, Mutual Funds, and ETFs traded on the US stock exchanges. Once you link your trading accounts, you will be able to see your holdings, trades, P&L, returns, and portfolio statistics in a single place.
11. Government Filings (EDGAR)
Price: Free (Open-source)
User Ratings: 4.9/5
Electronic Data Gathering, Analysis, and Retrieval (EDGAR) is an open-source database of filing documents for businesses in the United States. The Securities and Exchange Commission (SEC) requires public firms, and some insiders and dealers, to file periodic financial statements and certain disclosures.
All these databases are freely accessible to the general public. EDGAR stores such massive amounts of data for two main reasons:
- Increase the fairness and efficiency of the securities market
- Provide transparency in the marketplace
These filings are widely used by traders, investors, and finance professionals to make informed decisions when investing in a company.
The databases can be accessed in many different ways. There are numerous categories for the company of posted documents, such as divisions, enforcement, education, regulation, filings, and news.
EDGAR processes more than 3,000 filings every day, serves over 3 petabytes of publicly available data every year, and accommodates 40,000 new filers annually on average. All in all, EDGAR is one of the most beneficial resources for competitive analysis.
12. Trading Economics
Price: Starts at $199 per month
User Ratings: 4.4/5
Trading Economics gives you access to more than 20 million economic indicators for 200 countries. This includes historical data and delayed and live quotes for stock market indexes, government bond yields, exchange rates, and commodity prices.
It pulls data from official sources (not third-party providers) and regularly verifies facts for inconsistencies. Using its Android and iOS app, you can receive alerts for economic indicators, set up price targets, and record price fluctuations for financial markets.
So far, the platform has received more than 1.2 billion page views. Their revenues are well diversified: nearly 40% come from API sales to businesses and institutions, 40% from recurring subscriptions, and 20% comes from advertisements on the website. Unlike many other startups, Trading Economics has been profitable since its first month in business.
Frequently Asked Questions
Is there a free alternative to the Bloomberg Terminal?
You can try Thinkorswim. It charges zero commission on online stock, ETF, and options trades. It is equipped with professional trading tools and backed by quality data, insights, and a dedicated trade desk.
Thinkorswim is a fully customizable platform that gives you up-to-the-minute news as well as the analysis to help you interpret it. With more than 400,000 data points, you can discover new key indicators and chart them over time against your own analyses. It also has social sentiment tools to measure social media trends with charting indicators.
What language is the Bloomberg Terminal written in?
The server-side of the Bloomberg Terminal is written in Fortran, C, and C++. Whereas the client-side is mostly written in JavaScript.
Is Bloomberg terminal outdated?
Since Bloomberg Terminal was introduced in 1984, it has been the go-to platform for traders and investors to access information, analyze data, and place trades. Bloomberg Platform was able to establish a strong lead against its rivals. For decades, no tool had been able to compete seriously with Bloomberg Terminal (although many have tried).
However, we now have plenty of good alternatives available in the market at different price points. Unlike Bloomberg Terminal, they don’t require special hardware and offer a bundle of services at affordable prices.
Read More

