Market research is one of the most important components of business strategy and a major factor in maintaining competitiveness.
It’s a systematic way of studying the consumer and gathering information about their needs and beliefs. The research can also be used to discover how consumers act and determine how a product could be marketed.
There are several reasons why market research is crucial, especially for smaller teams and businesses:
- Spot business opportunities
- Lower business risks
- Know where to advertise
- Set better goals for the business
- Make informed decisions
- Outsell competitors
All in all, understanding legislative trends, changing consumer preferences, and industry shifts can make or break the business. That’s the value of market research.
Market research tools have come a long way in the past couple of years. Conducting market research is no longer a massive, tedious task like it was a decade ago. Below, we have listed some of the advanced tools that take a lot of hard work off your hands.
Table of Contents
13. Pew Research Center

Price: Free
The Pew Research Center is an unbiased American research institute based in Washington, D.C. It informs the public about social issues and trends shaping the world. The institute regularly conducts public opinion polling, media content analysis, and various empirical social science research.
From journalism and media to global attitudes and trends, the official website of Pew Research Center contains thousands of free research that marketing folks can use to better understand and target their domain.
The site has a sleek user interface, and it uses tables and charts to reveal more granular data. Findings and methods are accurately described in sufficient detail, allowing readers to evaluate the credibility of the published results.
12. US Census Bureau
Price: Free
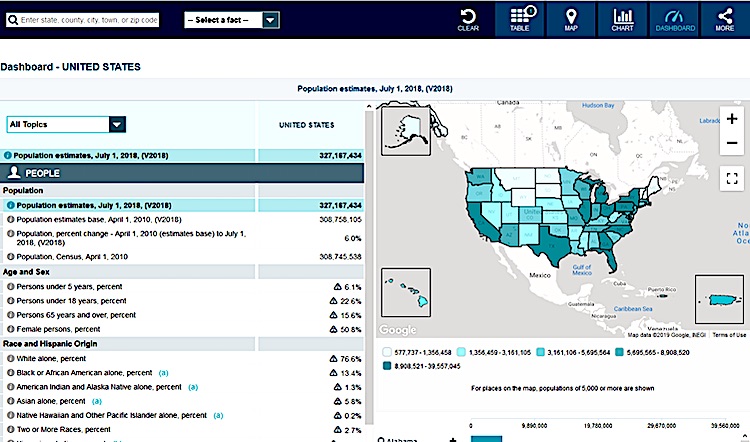
The Bureau of the Census is the part of the US Federal Statistical System, responsible for generating data about the American people and economy. The bureau conducts more than 130 programs and surveys each year, including the Current Population Survey, the US Economic Census, and American Community Survey.
The data provided by the census helps allocate over $650 billion in federal funds every year, and it helps businesses, local communities, and states make informed decisions.
Many companies and tribal governments use this information to examine the demographic characteristics of communities, plan roadways and transportation systems, decide the regions of new housing and public facilities, and create localized areas for colleges, utilities, etc.
11. Think With Google

Price: Free
Google has been accumulating data through its search engine and video platform for years. It’s also been instituting studies that provide a peek into the customers’ minds. This is the kind of information most marketing folks look for: it could tell who searches for what during what time of the year.
Think with Google provides compelling and actionable articles that help digital marketers improve their strategies with proven, timely suggestions. It could be an invaluable tool for advertisers who want to put an online ad this season for their new product launch.
The website has data tucked under categories such as Consumer Insights, Marketing Strategies, and Future of Marketing. The type of information that is offered is videos, infographics, facts and statistics, and case studies.
10. Google Trends

Price: Free
Introduced in 2006, Google Trends analyzes the popularity of top search queries across various regions and languages. It’s an invaluable tool for marketers who need information about what matters most to their audiences.
Google Search Engine processes more than 1.2 billion queries every year worldwide, which makes it one of the world’s largest real-time datasets. It can better reveal how people’s needs evolve when market dynamics change.
Trends presents an unbiased sample of Google search data. It is categorized, aggregated, and anonymized. You can search for a specific topic or a particular term and see where (region) it’s most-searched and what else people search for related to this topic.
9. Facebook Audience Insights

Price: Free
With more than 2.45 billion monthly active users, marketers are missing an opportunity if they don’t use Facebook for marketing purposes. The Facebook Audience Insights provides information about two groups: people connected to your Fb page and people who have an account on Facebook.
Like Facebook Page Insights, Audience Insights shows data of groups of people, which helps you create and target content and find people that are more likely to engage with your content.
It is designed to help marketers learn more about their target audiences, including aggregate information about demographics, locations, and purchasing behavior. The more data samples you have, the better you are equipped to deliver meaningful ads/products to people.
8. Qualtrics Stats iQ
Price: Varies according to the project size and complexity
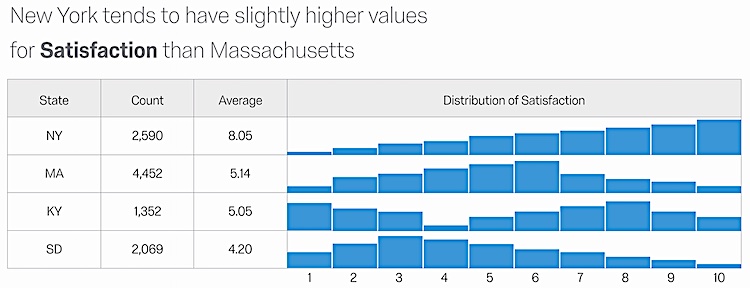
Stats iQ from Qualtrics gives everyone, from expert analysts to beginners, the power to detect meaning in data, uncover hidden trends, and generate predictive models, with no statistical training required.
Upload your data, and this tool will automatically run the right statistical tests, apply appropriate visualizations, and then translate the results into simple language that anyone can put into action.
The tool decides and applies the most accurate regression method. It also identifies problems within the data and results and provides effective solutions.
7. Tableau

Price: $70 per month
Tableau is a visual analytics platform that aims to help people better understand data. It allows users to transform raw data into an easily understandable format with zero technical skills and coding knowledge.
The software can pull data from any platform and any database, be it Oracle, PDF, Excel, Google Cloud SQL, or Amazon Web Services. Data analysis is very fast with Tableau. Users can easily create visualizations in the form of worksheets and dashboards.
The three best features of this tool are data blending, real-time analysis, and collaboration of data.
For clear understanding, Tableau data analytics can be categorized into two groups: Developers tools (for creating charts, reports, and dashboards) and Sharing tools (for sharing visualizations, dashboards, and visualizations).
6. BuzzSumo
Price: Starts at $79 per month
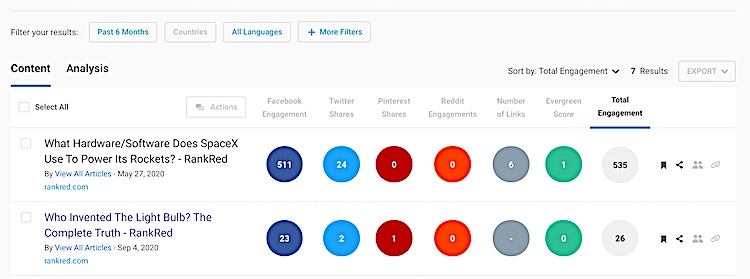
One of the key metrics that determine the success of content, such as blog posts, is the extent to which the content is shared on social networking platforms. BuzzSumo helps you ensure that you are putting out top content that resonates with your audience.
The tool gives valuable insights into the success of your content on platforms like Twitter, Facebook, Pinterest, and LinkedIn. You can also take a deep dive into competitors’ backlinks to see how they are performing.
Content marketers can use BuzzSumo in four different ways:
- Find what’s getting shared on social media
- Evaluate current topics and trends
- Analyze data to create engaging content
- Find influencers who can publish/share your content
All in all, it really does give marketing folks an extra edge to ensure they are working as smartly as they can.
Read: 22 Free Social Network Analysis Tools
5. Moz

Price: Starts at $79 per month | Free 30-day trial available
Moz focuses on one of the least understood and least transparent aspects of great marketing: search engine optimization (SEO). It simplifies SEO for everyone through its education, community, and software.
Moz provides accurate tools for technical site audits, rank tracking, backlink analysis, and keyword research. One of its most popular tools named Open Site Explorer, helps you understand your visitors. It tells you how people are searching for your service/products, which questions are being used, and what questions are being asked related to your products.
If you are short on time, they have condensed all the need-to-know SEO essentials into a handy hour-long video series. It teaches you about SEO analytics and reporting, content marketing, and social media and influencer marketing.
4. SurveyMonkey
Price: Starts at $25 / user / month
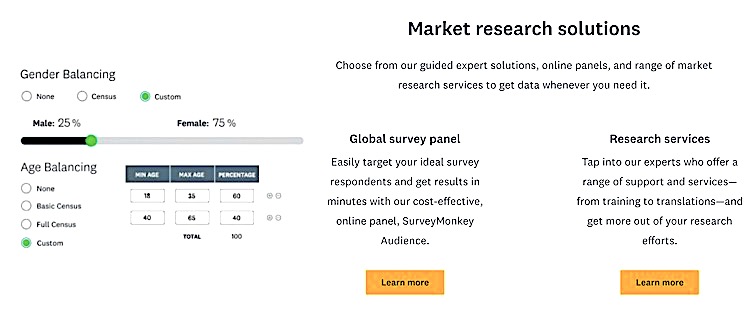
SurveyMonkey is the world’s leading survey platform, trusted by 98% of the Fortune 500 and more than 60 million users worldwide. It presents all the necessary tools for creating strong, professional surveys easily.
Although the exact feature depends on the pricing plans you choose, the free version gives you access to basic tools and templates. Only 10 questions per survey (with a maximum of 100 responses) are allowed in the free version.
Survey software is worthless without proper collection and analysis. SurveyMonkey performs well in both areas. It allows you to administer and send surveys to customers via a number of ways — web link, embed link, social link, email, and pop-ups. Premium plans provide enhanced security options.
You can view individual responses, analyze inputs in real-time, and filter and compare results. With the premium version, you can download responses, access multiple custom reports, and create custom charts.
3. Mixpanel

Price: Free | $17 per month for growth plan
Mixpanel tracks user interactions with web and mobile apps and provides tools with targeted communication with them. Unlike Google Analytics, which is based on page views, Mixpanel focuses on event tracking.
It is used by several Fortune 100 SaaS companies to increase product engagement and customer retention. It helps them measure what matters, make decisions fast, and develop better products using data.
Mixpanel offers product analytics solutions that allow teams to analyze how people interact (in realtime) across devices and enhance user experience. The free version lets you track activities of up to 100,000 monthly users.
In addition to analyzing data, you can also make tweaks to your product’s in-app messaging via Mixpanel. Run experiments, test various messages to see which boosts product adoption the most. It also detects the accounts you should be upselling to, so you can maximize your monthly recurring revenue.
2. Gartner
Price: Depends on the type of account and location
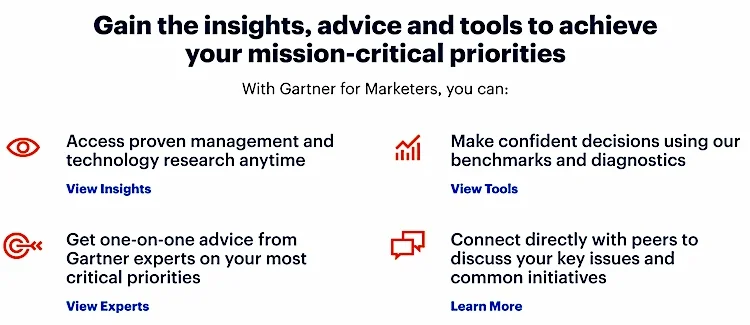
Gartner is a global research and advisory company that helps executives across the enterprise make the right decisions and stay ahead of market change. It offers three services:
- Trusted insights: robust metrics and verified peer-driven research.
- Strategic advice: personal guidance to help you focus on things that truly matter.
- Practical tools: automated programs to help you turn strategy into decisions and analyze results.
Gartner serves more than 15,000 organizations (including technology companies, government agencies, large corporations, and the investment community) in over 100 countries.
Read: 12 Free RAR Extractor Tools
1. Statista

Price: Starts at $39 per month
Statista specializes in market and consumer data. Its statistics and survey results can help you understand what’s the size of your market segment, how markets are developing, and what are the trends behind these developments.
It could be extremely helpful for business owners, researchers, and lecturers. The information provided by the platform covers advertisements, the buying behavior of customers, sales and revenue of various companies, among other things.
The website contains over one million statistics on over 80,000 subjects from more than 22,000 sources and 170 different industries. Most of them are presented in tables and charts for easy understanding.
Read: 6 Best Deepfake Apps and Tools
The free version gives you access to 7% of the English statistic database and allows you to add any statistic to your document or presentation as a high-resolution PNG file.

