Founded in 2010, Datadog has become one of the most popular monitoring and security systems. It allows businesses to efficiently track performance metrics, implement cloud-based services, and monitor every aspect of the infrastructure.
In FY 2025, the platform generated over $3 billion in annual revenue and served more than 30,500 customers worldwide, including well-known brands like Airbnb, Samsung, Whole Foods, and Peloton. In fact, its client base includes over 40% of the Fortune 500, highlighting its importance as a mission-critical partner in IT operations.
Datadog processes trillions of data points daily and integrates with over 600 technologies, from AWS and Microsoft Azure to Kubernetes and Docker. Enterprise adoption is strong, with the number of customers spending over $100,000 annually on Datadog subscriptions growing nearly 20% year-over-year.
Despite this dominance, the industry is highly competitive, with rivals offering specialized capabilities, stronger pricing models, or regional advantages. For small and medium-sized businesses, there are many great alternatives available at attractive prices.
Below, we have compiled a list of the best Datadog competitors and alternatives based on ease of use, features offered, and developers’ experience. This will help you evaluate different platforms in terms of integration, deployment, specific product capabilities, and customer service and support.
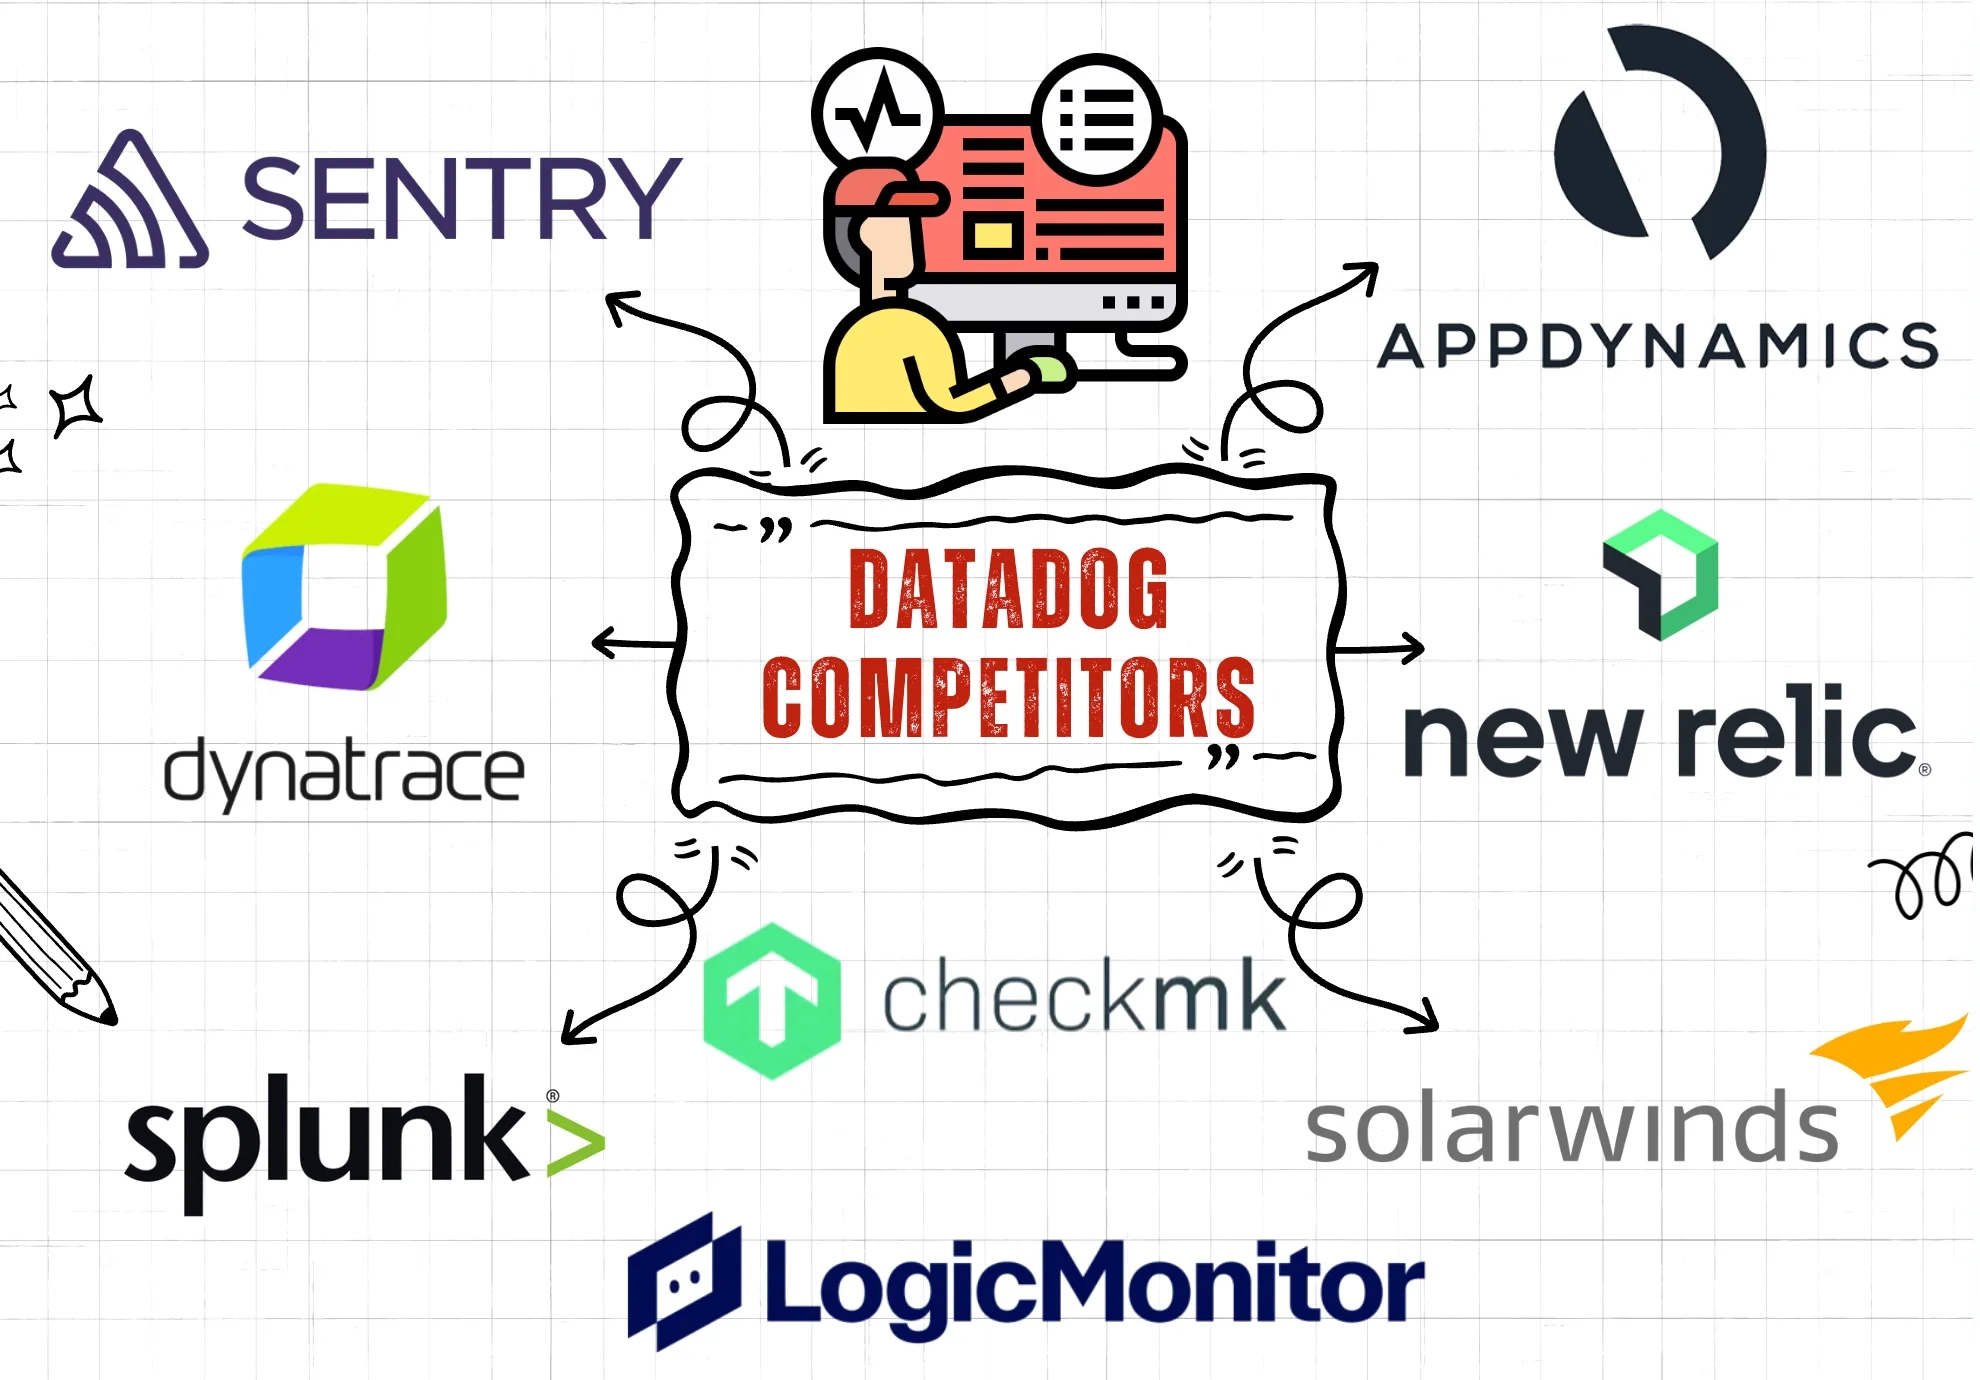
Table of Contents
13. Prometheus
Price: Free
Released in 2012
Rating: 8.7/10 from 100+ customers
Prometheus gathers metrics from configured targets at specific intervals, evaluates rule expressions, shows results, and can trigger alerts when certain conditions are met.
This open-source platform is performant and simple to run. It seamlessly integrates into the infrastructure, allowing you to track system health, behavior, and performance.
The features that distinguish Prometheus from other monitoring tools are:
- Time-series multidimensional data model
- PromQL (query language) leverages the multidimensional data model
- All individual server nodes remain autonomous
- Numerous types of dashboards and graphs
- Many client libraries and integration options
Written in the Go programming language, its source code is available on GitHub under the Apache 2 License.
With its latest release, Prometheus is positioning itself as a first-class backend in the observability ecosystem. The update brings an improved UI, stronger interoperability with OpenTelemetry, enhanced remote write capabilities, and histogram support. These features make it more practical and effective for large or complex deployments.
12. Sentry
Price: Starts at $26 per month | Free version available
Released in 2011
Rating: 8.8/10 from 200+ customers
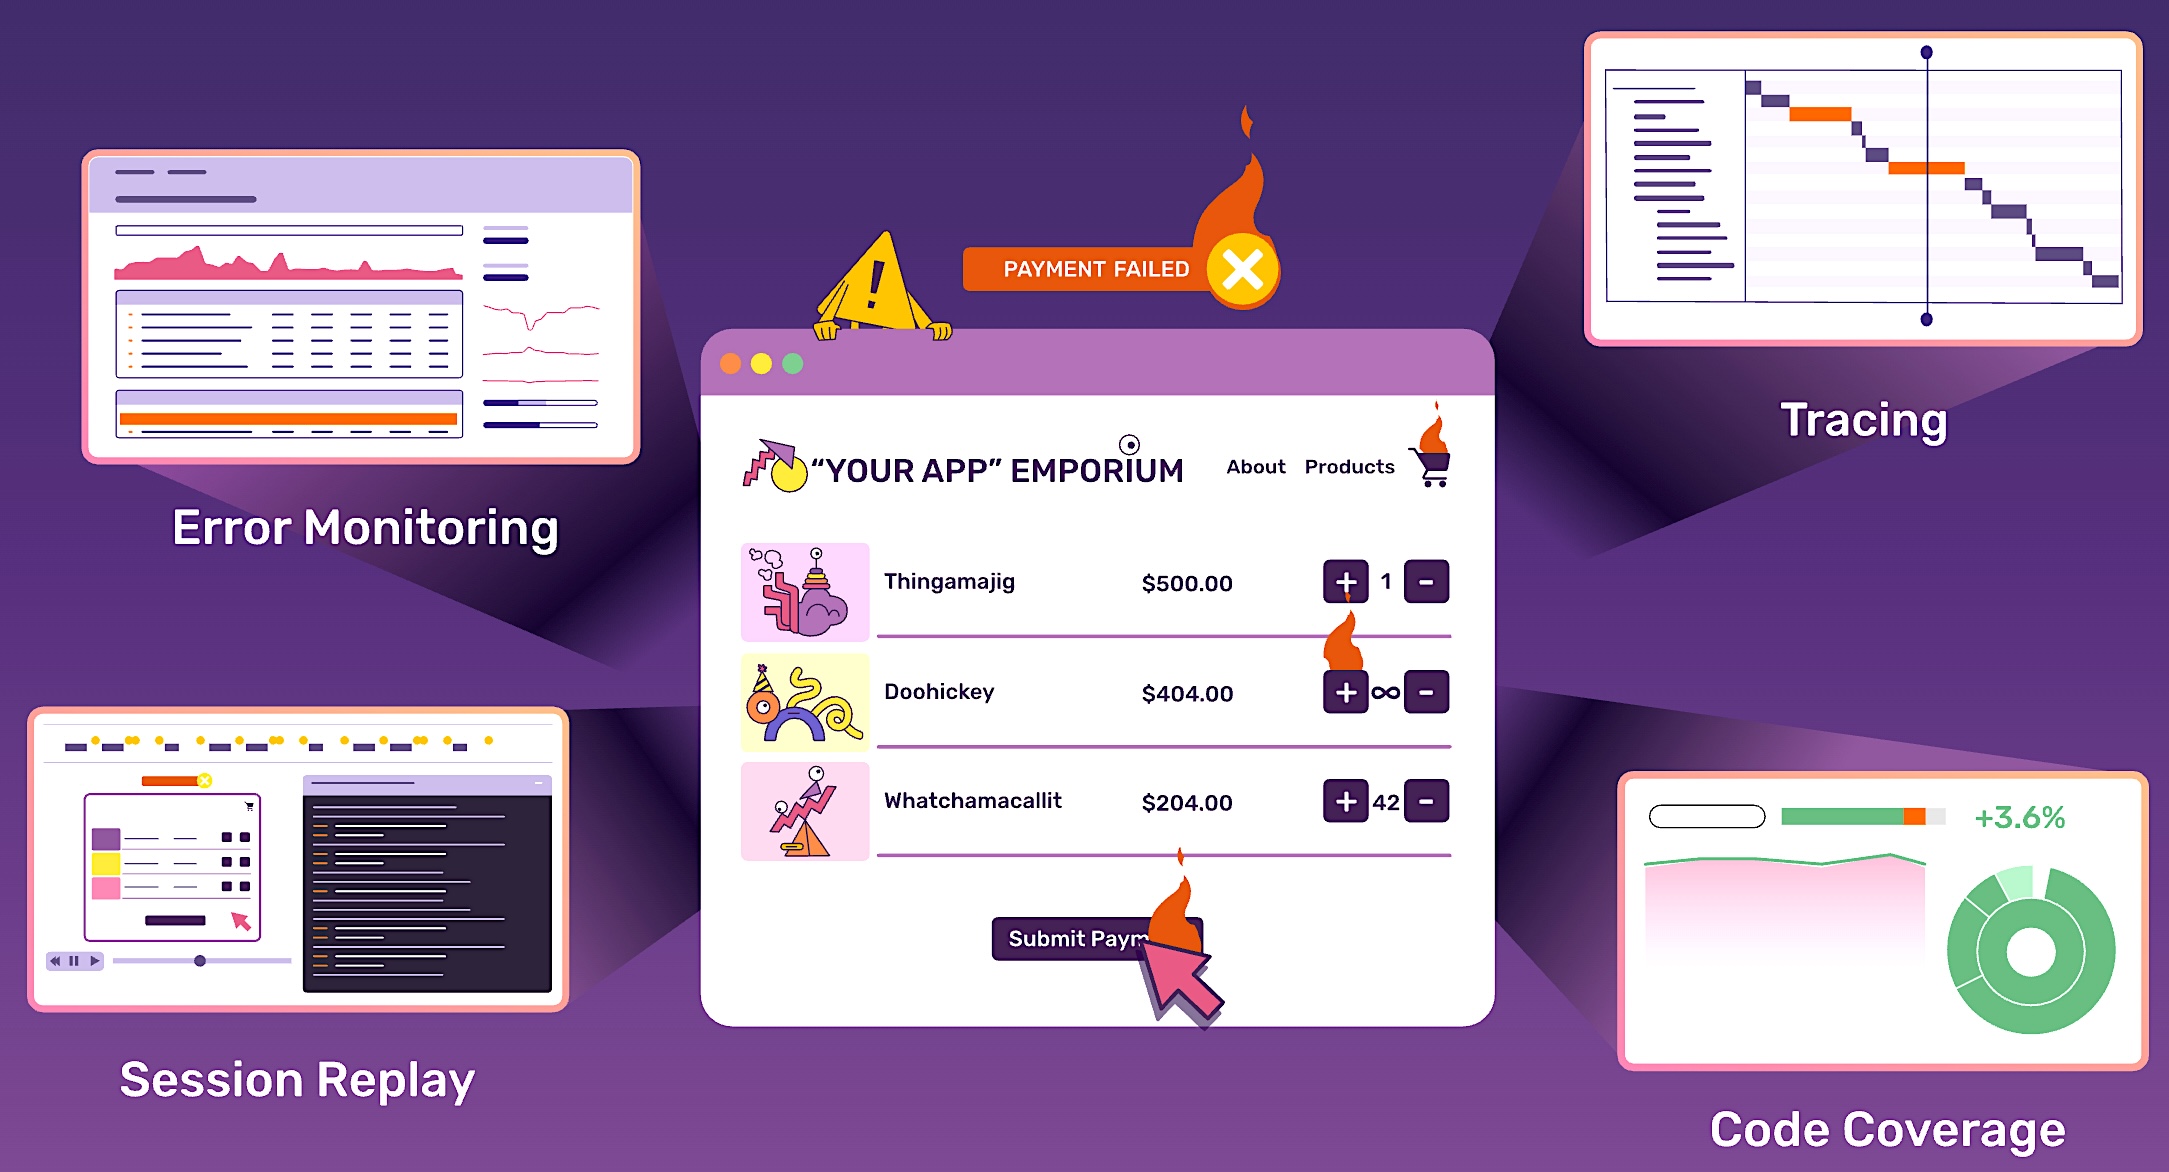
Designed for developers, Sentry is an open-source performance monitoring and error-tracking platform. It shows what’s causing the problem, down to the line of code.
The platform is quite easy to implement. You can set it up with just 5 lines of code — no agents or professional services are required. Once everything is set up, Sentry will automatically start gathering device information.
Within an hour, you will see how quickly your application starts, which process is consuming excessive resources, and how well your application performs on real-user devices.
Since Sentry was founded on open-source principles, you will find almost all of the code (that powers sentry.io) on GitHub. Their most popular customers include Microsoft, GitHub, VMware, Disney, Atlassian, Autodesk, Cloudflare, and Reddit.
In 2025, Sentry acquired Emerge Tools, a startup specializing in pre-development mobile solutions such as app size tracking, launch performance, and code health. The acquisition is intended to strengthen Sentry’s mobile and launch performance offerings by adding more “pre-code-ship” metrics.
As for pricing, Sentry gives 5 GB free per month, and additional logs are at $0.50 per GB.
11. Splunk

Price: Starts at $15 per month per host | Free trial available
Released in 2003
Rating: 8.5/10 from 2,100+ customers
Splunk makes it easier to search, visualize, and analyze the machine-generated data gathered from apps, websites, sensors, and devices. It can analyze massive amounts of data and detect the signal from the noise faster, at scale.
Its proprietary schema-on-read technology enables you to extract answers from unstructured data and add structure on the fly. The full-fidelity data coverage and machine learning models give the real-time insights you need to enhance workflow and effectively scale operations.
All in all, Splunk is a flexible and scalable platform that can address almost any use case. It is supported by a community of over 13,000 active members and 1,800 experts, along with more than 2,800 apps on Splunkbase that allow businesses to build customized solutions for their specific needs.
Splunk has over 10,000 employees and holds more than 1,300 patents. In 2024, it surpassed $4 billion in annual revenue, marking a 15% year-over-year increase.
In 2025, Splunk was named a Leader in the Gartner Magic Quadrant for Observability Platforms. It also stands out as a leader in both SIEM and Observability.
10. SolarWinds
Fewer crashes, more peace of mind. That’s the benefit of giving your database proactive care, so you can focus on moving projects forward, not putting out fires.#DBALife #SQLMonitoring #OpsReady #SolarWinds pic.twitter.com/kFx5h9x6k9
— SolarWinds (@solarwinds) August 15, 2025
Price: Different tools have different pricing plans | 30-day free trial available
Founded in 1999
Rating: 8.7/10 from 2,000+ customers
SolarWinds is one of the most popular monitoring, observability, and service management platforms. It can seamlessly integrate with your critical business services to provide complete visibility and control of your infrastructure.
Its network management tools, for example, can monitor device performance, analyze traffic and bandwidth, and provide insights into network faults, network availability, and IP address management in a single console.
AppOptics, a SaaS-based application monitoring tool, provides full-stack visibility and helps identify the root cause of performance issues. It allows you to drill down into performance and resource usage across processes, containers, and services. You can also enhance your system with a cloud-based intelligent ticketing system, knowledge base and portal, and secure remote support.
In 2025, SolarWinds acquired Squadcast, a platform for incident response, on-call management, and SRE workflows. The goal is to unify observability with incident response.
Reported benefits include up to a 68% reduction in mean time to remediation (MTTR), significant savings in work hours and costs, and features such as alert correlation, Slack/Teams integration, and standardized runbooks.
As of today, SolarWinds has more than 300,000 clients, including 96% of Fortune 500 companies and many federal agencies.
9. Instana
Price: Starts at $75 per month per host | 14-day free trial available
Released in 2015
Rating: 8.8/10 from 750+ customers
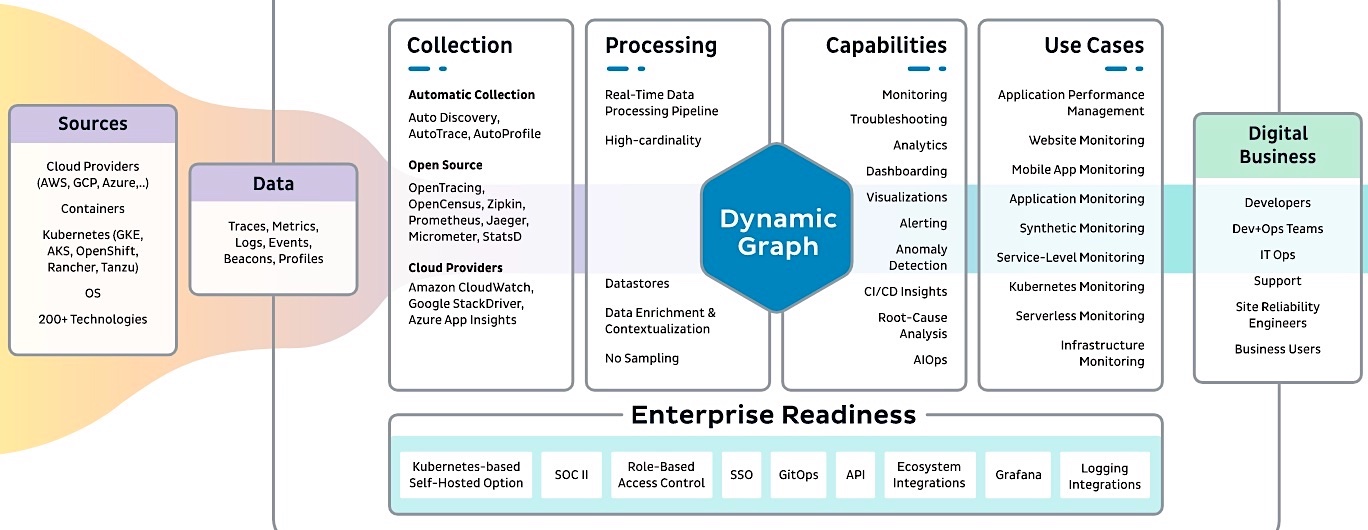
IBM Instana is an enterprise application performance monitoring platform that helps you improve apps’ performance and (CI/CD) pipelines no matter where apps reside — on-premises, private cloud, public cloud, or hybrid cloud.
The platform can gather millions of metrics from all components in high fidelity with one-second data granularity. It then organizes the collected data into dependency relationships, the Dynamic Graph, while regularly modeling the infrastructure and services.
Instana applies proprietary machine learning and preset health rules to determine the health of each component. It then creates “issues” for all unhealthy components, while incidents are only generated when users are affected by those unhealthy components.
These incidents include metrics, logged errors, configuration data, traces, and exceptions. They help you identify the root cause of the problem.
Key Features
- Serverless and end-user monitoring
- Historical data and root cause analysis
- Intelligent alerts based on automatic or manually configured baselines
- Pre-configured dashboards based on performance indicators
Moreover, the platform provides you with the flexibility to filter every aspect of your data in countless ways, making it easier to discover uniquely tagged traces, problem patterns, and performance outliers.
As for pricing, Instana offers two plans: Self-hosted (which costs $93.80 per month per host) and SaaS (which costs $75 per month per host). Both are fully featured and support an unlimited number of users.
In G2 Fall 2025, Instana earned leadership positions in multiple categories, including AIOps, Application Performance Monitoring (APM), Cloud Infrastructure Monitoring, and Container Monitoring, across Overall, Mid-Market, Small Business, and Momentum segments.
8. Zabbix
Price: Free
Released in 2001
Rating: 8.6/10 from 600+ customers
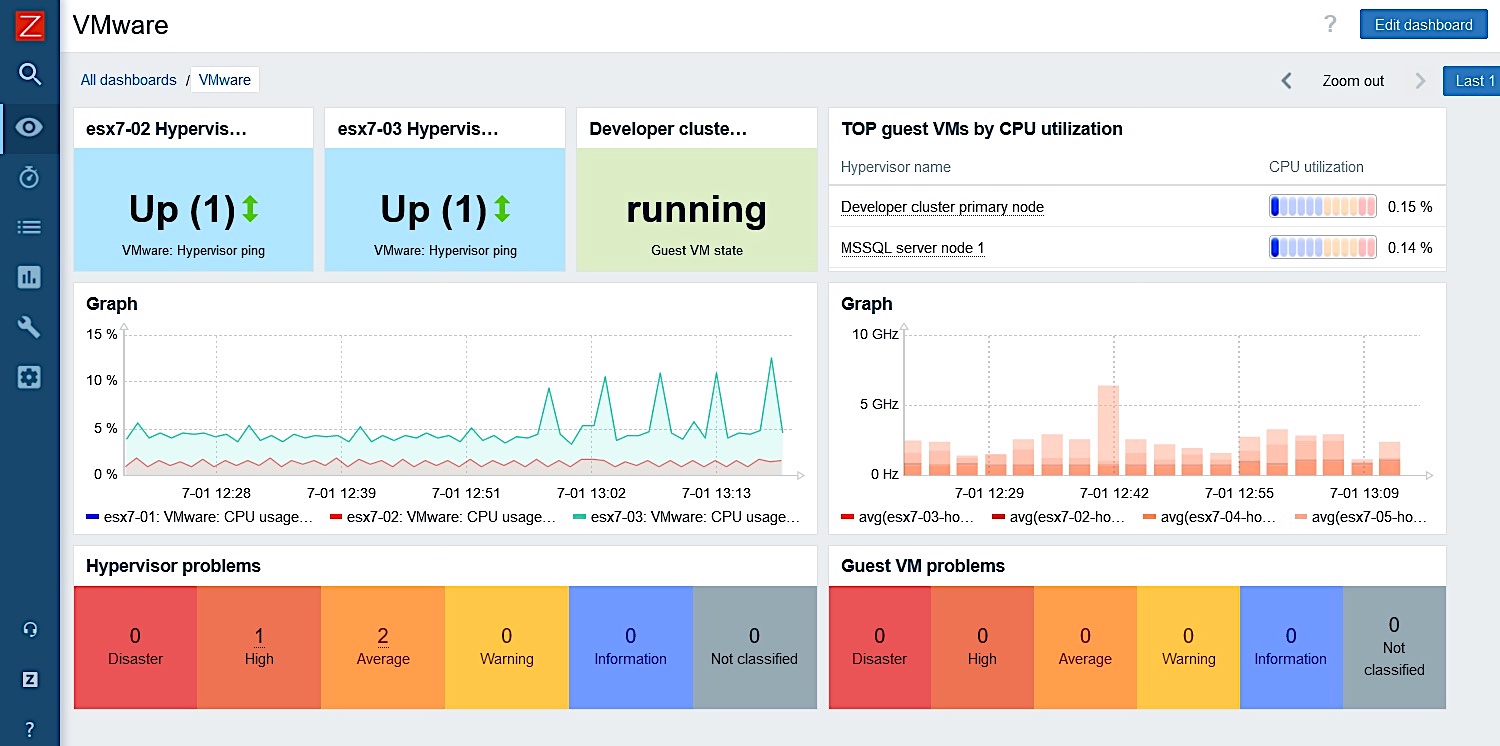
Zabbix is an open-source distributed monitoring platform designed to analyze the performance and availability of network devices, servers, cloud services, and other IT resources.
It is an all-in-one monitoring solution that allows businesses of all sizes to collect, store, analyze, and manage data received from IT infrastructure. It can handle millions of metrics gathered from tens of thousands of network devices, servers, and virtual machines, efficiently scaling to even larger environments.
Besides just monitoring infrastructure, Zabbix can provide different levels of monitoring services in a multi-tenant environment. Admins can change permissions and roles to isolate users, create unique dashboards to provide specific insights, and generate and send custom scheduled reports to users.
Key Features
- Powerful data visualization
- Predicts trends and detects anomalies
- Gives alerts on critical issues
- Enterprise-grade security
Since Zabbix is an open-source platform released under the GNU General Public License version 2, it provides advantages that proprietary tools cannot.
For example, businesses can run internal audits to ensure the code meets their security policies. They also avoid vendor lock-in and have the flexibility to modify, add, or remove features as needed.
7. Sumo Logic
Price: Essential version starts at $80 per GB | Free version and a 30-day free trial available
Founded in 2010
Rating: 8.2/10 from 900+ customers
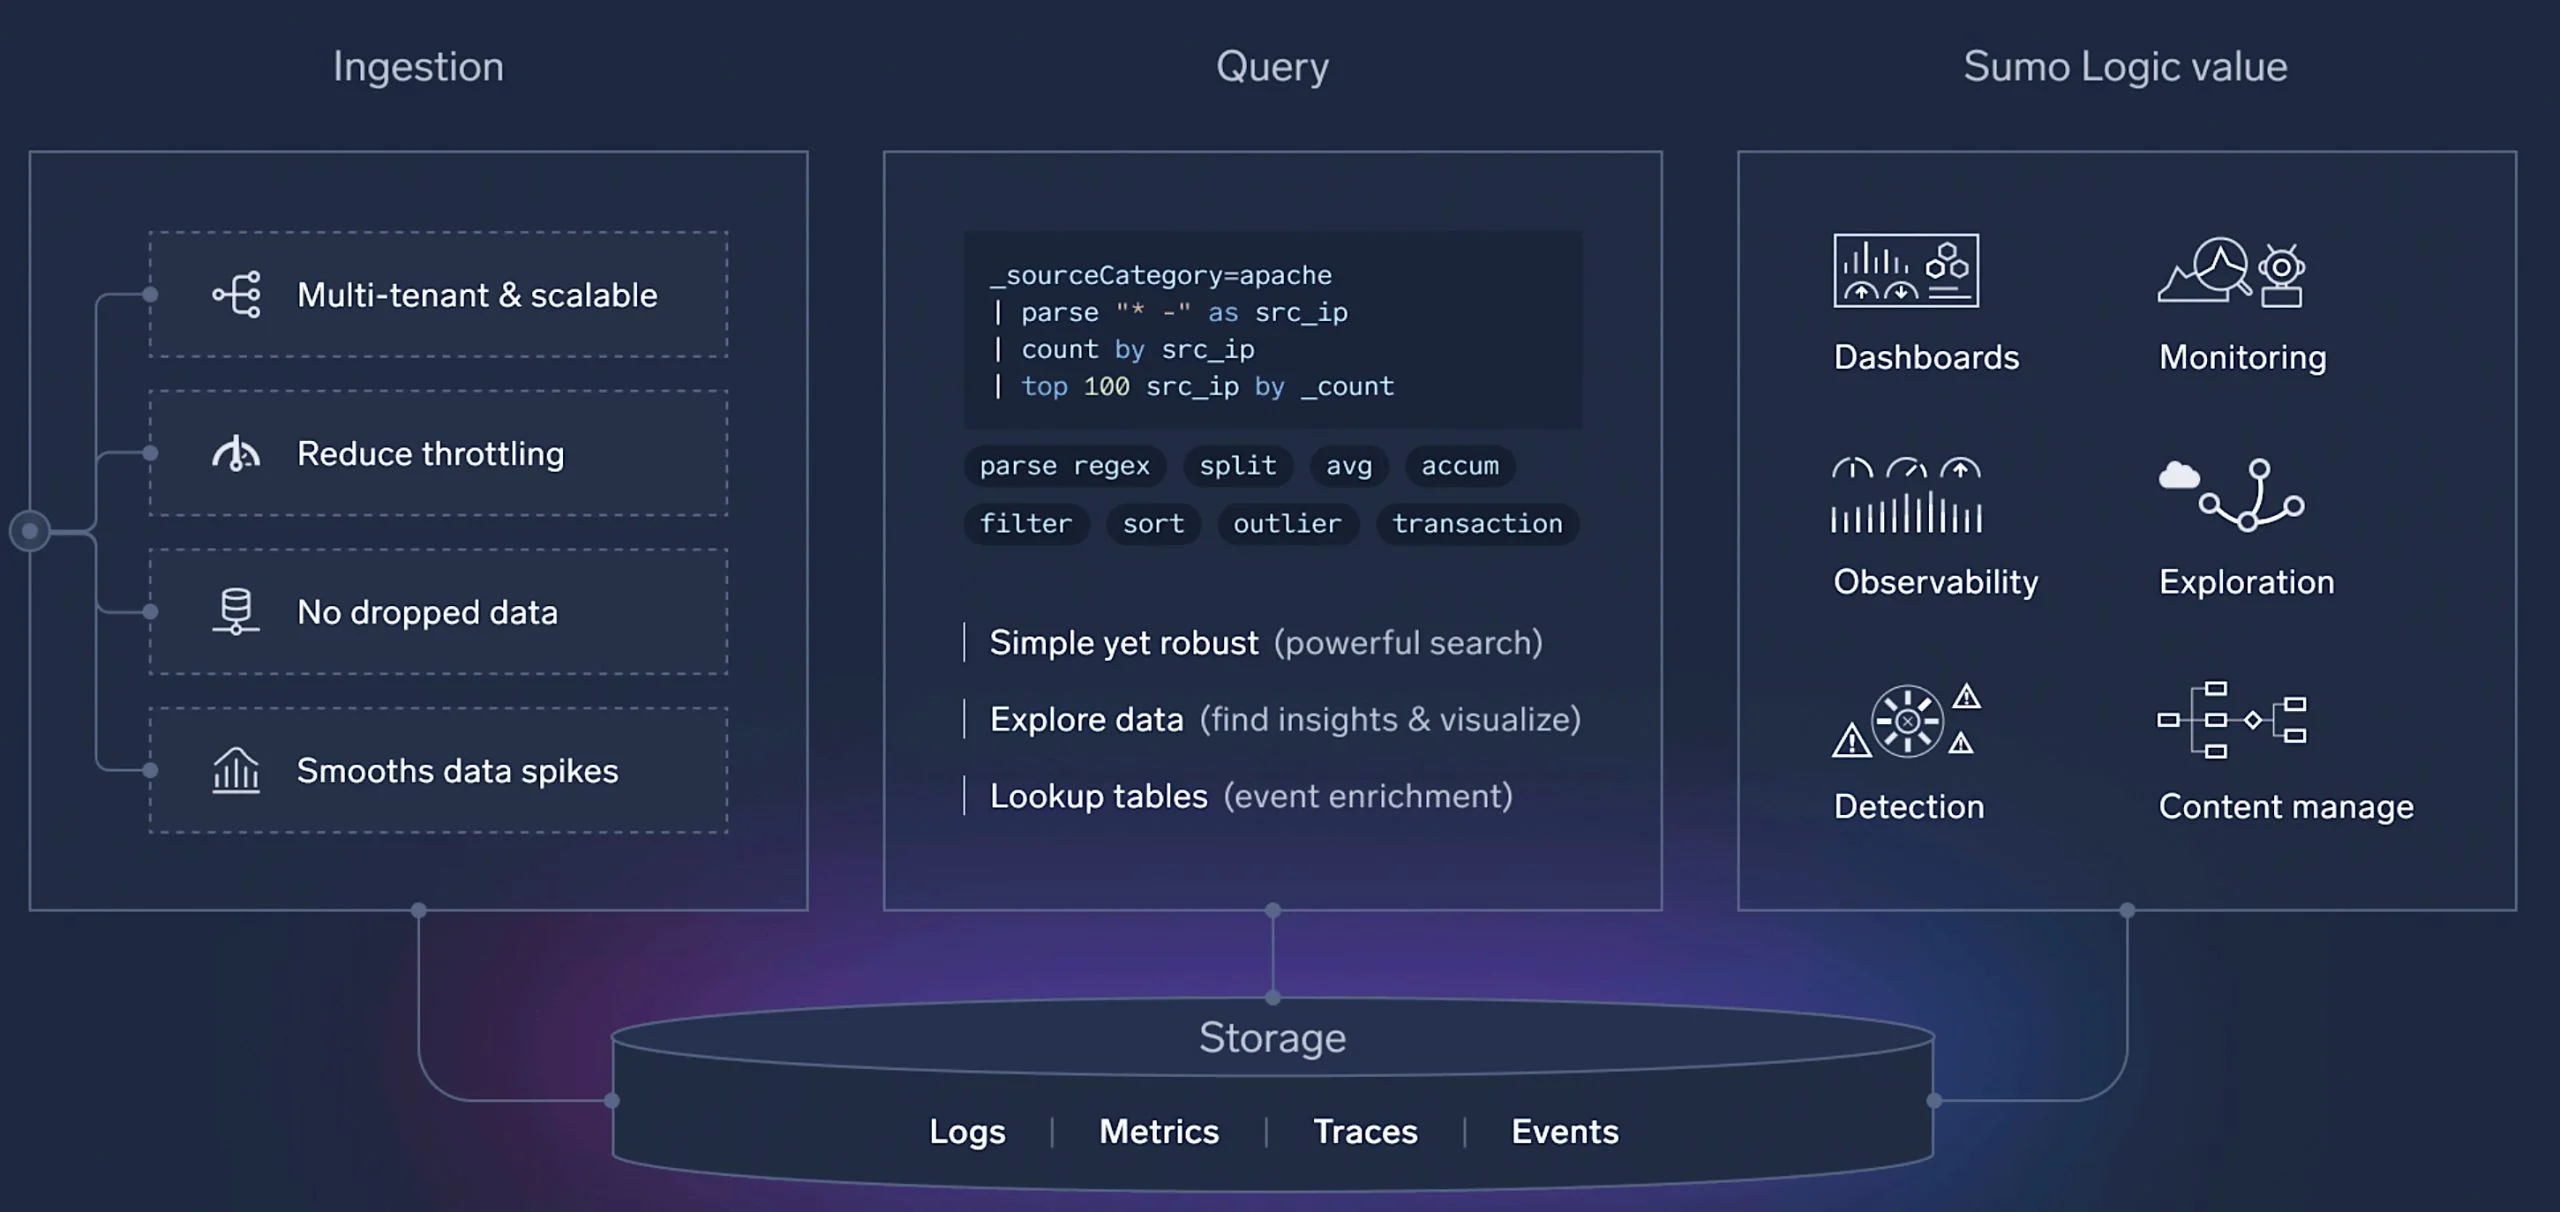
Sumo Logic is designed for companies of all sizes to address the data challenges presented by digital transformation, cloud computing, and modern applications. It automates the collection and analysis of applications, security, infrastructure, and IoT data, so business owners can gain valuable insights within seconds and make informed decisions.
Its patented technology (named LogReduce and LogCompare) finds and predicts anomalies in real time and uncovers the root causes of identified problems.
You can quickly turn hundreds of log lines into clear patterns, filter out noise, spot unusual behavior, and use standard benchmarks from popular stacks like Kubernetes and Apache to optimize your applications.
According to the company, Sumo Logic processes nearly 3.5 exabytes of data each day, runs over 100 million searches, and queries about 5.5 trillion user records across its platform daily.
Key Features
- Powerful and intuitive query-based analytics
- Prioritize and investigate security issues
- Ensure compliance readiness and security best practices
- One-click integrations with Azure, AWS, and Google Cloud Platform services
Sumo Logic also makes it easy to identify potential security threats across users, databases, devices, networks, and IPs. It uses proprietary algorithms to accelerate threat detection at cloud scales. Whether you are summarizing vast amounts of data or digging into specific apps, it’s fast and efficient to gain insights into active security threats.
The platform is trusted by more than 2,100 companies, including Airbnb, Alaska, BlueJeans, RazorPay, Toyota, Gumgum, and HootSuite.
6. Checkmk
Price: Enterprise version starts at $80 per month | Free version (with limited features) is available
Founded in 2008
Rating: 9.1/10 from 300+ customers
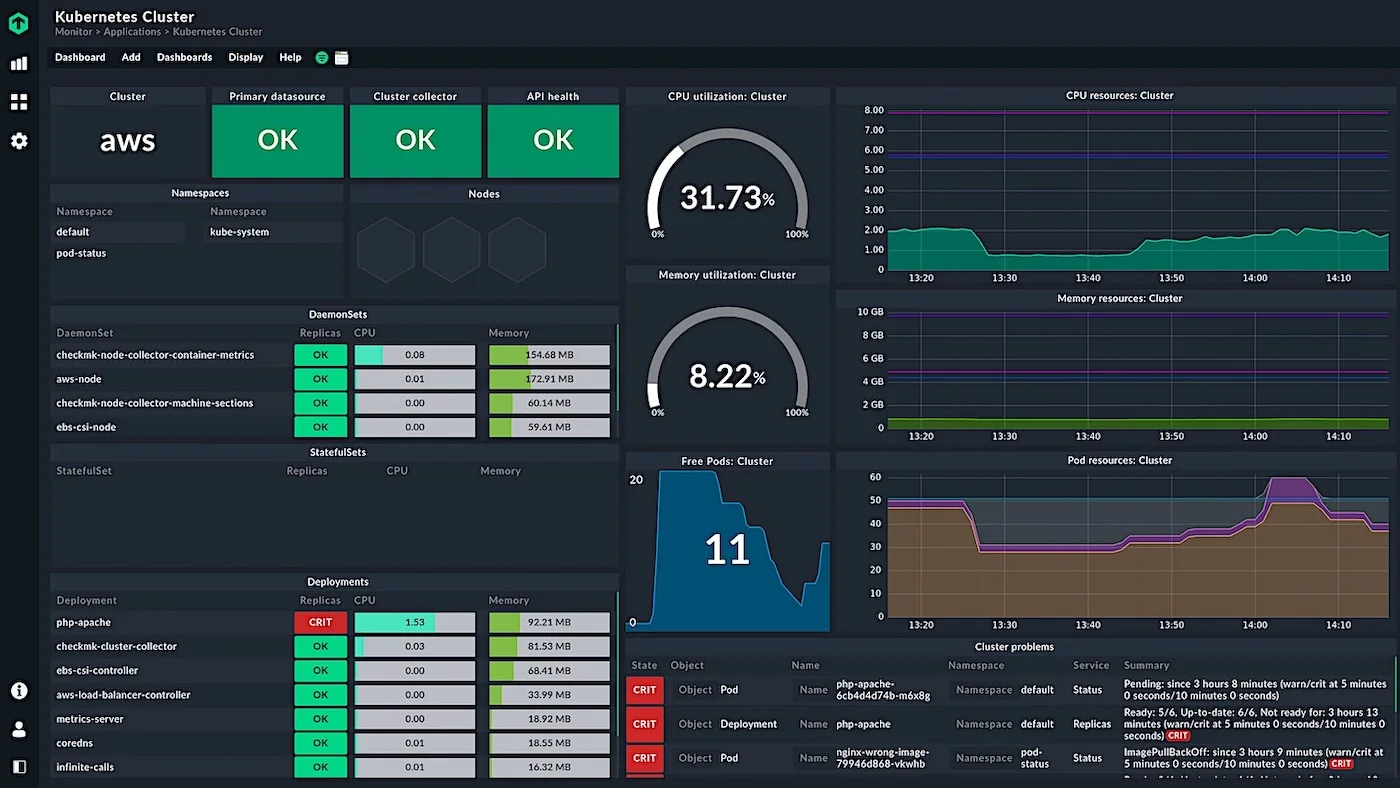
Checkmk offers a suite of tools to monitor networks, servers, and applications. These tools have been developed in collaboration with customers over several years. They are simple, user-friendly, and powerful enough for intricate IT environments.
The platform gives you detailed insights into your network, including in-depth views of traffic, packets, ports, and peers. Gather valuable metrics across heterogeneous infrastructure while avoiding unreliable, third-party plugins. Monitor the health of individual applications to identify which ones are not functioning properly or are not scaling well.
It also handles the complexity of Kubernetes. You can easily navigate through clusters with interconnected context-sensitive dashboards. There is no need to fine-tune any parameters. Pre-designed dashboards show you everything in a single pane.
Key Benefits
- Quick deployment (start monitoring within 10 minutes)
- Requires fewer resources on both the client-side and server-side
- Automated monitoring for dynamic infrastructures
- Maintain over 2,000+ plugins
Checkmk is available in two editions — an open-source edition named Raw (which is completely free) and an enterprise edition (which comes with auto-discovery, agent management, reporting, and other advanced features).
5. Coralogix

Price: Starts at $0.60 per GB ingested
Founded in 2014
Rating: 8.4/10 from 400+ customers
With Coralogix, you can analyze and monitor the entire data of your infrastructure in a single, centralized platform. Add data from any source, in any format, for extensive event correlation and streamlined troubleshooting.
The platform clusters millions of log records into specific patterns and identifies connections between those patterns, helping businesses understand their data and proactively solve their problems.
More specifically, it can parse and transform data on the fly, produce metrics from raw logs without indexing, and cluster noisy logs into templates.
Key Stats
- 2,000+ Global customers
- 10,000+ DevOps and Engineering Users
- 500,000+ Applications monitored
- 3,000,000 Events processed per second
The platform also ensures the security and compliance of your cloud environment. It continuously monitors systems for potential weaknesses and known security vulnerabilities to be fixed. Plus, the automated posture assessments ensure that your systems follow best practices and compliance standards (HIPAA, ISO, PCI, SOC, NIST, etc.)
As for pricing, you are charged for what you use. When it comes to data analysis, monitoring, and alerting, Coralogix charges you $0.60 per GB ingested. For lightning-fast queries or business-critical data, it charges $1.80 per GB.
In 2024, Coralogix acquired Aporia, a platform specializing in AI observability and guardrails. Aporia’s features have been integrated into Coralogix’s offerings, extending observability beyond traditional telemetry (logs, metrics, traces) to AI models, with capabilities such as detecting hallucinations, data leakage, and toxicity.
In 2025, Coralogix partnered with AWS to further enhance its observability and security solutions. The collaboration includes leveraging Amazon Bedrock for AI capabilities and integrating with AWS WAF and Amazon CloudFront for edge monitoring, real user monitoring, and threat detection.
4. LogicMonitor

Price: Based on business requirements | Volume discounts available | Free trial available
Founded in 2007
Rating: 9/10 from 1,000+ customers
LogicMonitor is an agentless SaaS-based monitoring platform that comprehensively analyzes infrastructures, from on-premises to the cloud. No matter what business you are in, it makes it easier to forecast utilization, detect anomalies, and identify performance issues before they affect the revenue.
The platform is integrated with tons of tools to visualize networks and troubleshoot issues faster. It can auto-discover over 2,500 network devices manufactured by top brands like Juniper, Cisco, and Meraki.
Then, you can drill down into individual interfaces, firewalls, switches, routers, load balancers, and wireless devices on the network. The dashboard gives you a detailed report on network performance and helps you pinpoint bandwidth issues and performance bottlenecks.
Key Features
- Monitor critical database metrics like active connections, throughput, and query execution performance
- Log analysis to further reduce MTTR
- Intelligently predicts performance levels and alerts you when those thresholds are exceeded
One of its unique systems, called “Dynamic Thresholds,” utilizes advanced anomaly detection models to determine a resource’s expected range based on past performance. It then alerts you when something falls out of this range. It tracks all important metric values, metric rate of change, and metric patterns.
All in all, LogicMonitor shows you only what you need, right when you need it. According to the company, its in-depth reporting and real-time alerts can reduce Mean Time To Repair (MTTR) by 40%.
In 2025, LogicMonitor partnered with Infosys to integrate its Edwin AI with Infosys AIOps Insights. The collaboration aims to reduce problem diagnosis and resolution time by up to 30%, eliminate redundant alerts by approximately 70%, and deliver persona-based insights.
3. AppDynamics

Price: Starts at $6 per month per CPU core | Free trial available
Founded in 2008
Rating: 8.8/10 from 1,400+ customers
AppDynamics focuses on managing the performance and availability of apps across data centers, network architecture, IT infrastructure, cloud computing environments, application security, and threat detection.
In 2017, Cisco acquired AppDynamics for $3.7 billion. And since then, it has become a key driver in the Cisco products portfolio, offering innovative services to meet the demands of digital companies.
The platform makes it easier for its customers to measure crucial business metrics (like conversions and return on investment) and resolve issues before they affect sales.
One can locate the root cause of issues in real time, from third-party APIs down to code-level issues. View how applications rely on external networks to quickly resolve issues with DNS, ISP, or SaaS providers.
Key Benefits
- Provides complete visibility into all components of your app ecosystem
- Instant root-case analysis
- Automated actions to optimize your application environment
- Isolate network issues across third-party networks and SaaS
Cisco’s RASP (short for Runtime Application Self-Protection) solution keeps both users and digital businesses safe by defending against malicious programs. It automatically blocks threats in real-time, safeguarding customer data, organizational IP, and brand equity.
Cisco has introduced new virtual appliance options for AppDynamics On-Premises, featuring built-in AI capabilities such as anomaly detection, automated root-cause analysis, and threat and vulnerability detection across application stacks, including SAP environments.
For example, AppDynamics can now correlate SAP (ABAP) and non-SAP metrics, provide code-level visibility into ABAP, and offer dashboards for monitoring SAP performance.
The platform is widely used in enterprise SaaS applications and public sectors (from manufacturing and telecommunication to financial and healthcare industries) for full-stack observability and IT infrastructure monitoring.
2. New Relic
Price: Free for up to 100 GB data ingest per month | $0.30 per GB beyond free limits
Founded in 2008
Rating: 8.8/10 from 2,000+ customers
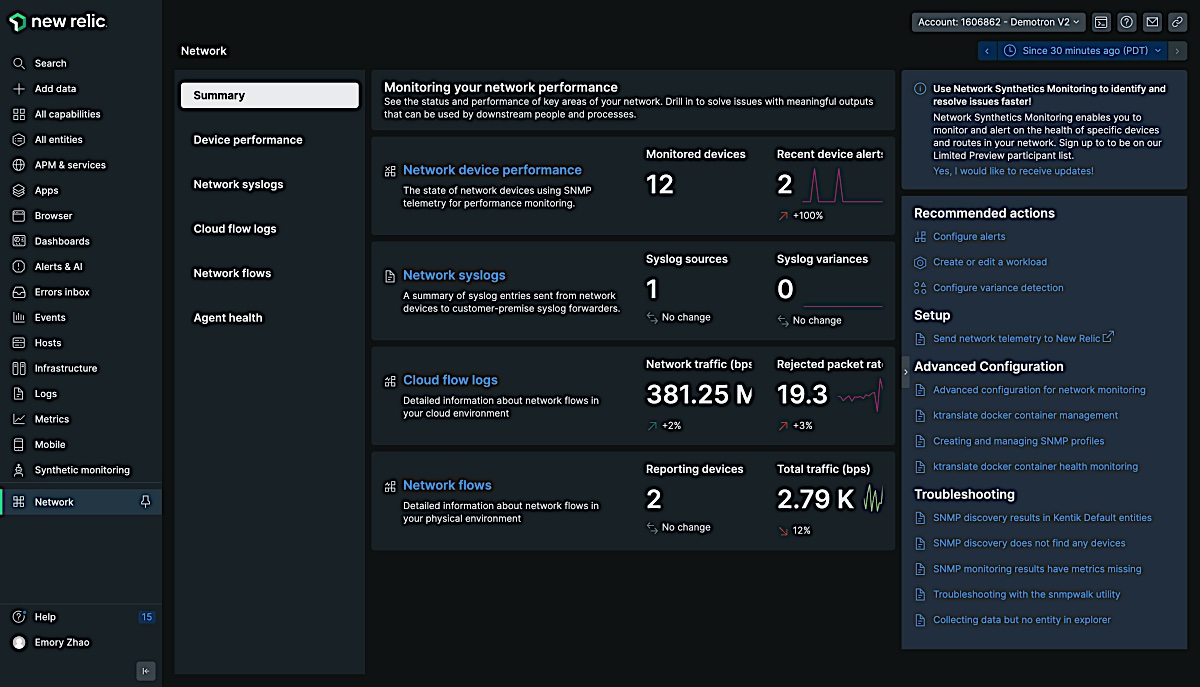
With New Relic, you can monitor your entire stack within minutes. It provides historical and real-time insights into the performance and reliability of mobile and web applications. These insights help you respond faster, optimize better, and develop more perfect apps.
The platform utilizes a standardized application performance index score to determine and rate app performance across the infrastructure. It gives you a 360-degree view of apps, from frontend user devices to backend APIs.
You can visualize dependencies with automaps, drill into errors to quickly identify root causes, diagnose cluster behavior, and troubleshoot performance bottlenecks.
And since everything on New Relic runs on the world’s most efficient telemetry database, you can instantly slice and dice complex data into flexible visualizations. The platform gives you the power to analyze over 50 billion events in a single query, with each query having an amazing response time of 60 milliseconds.
Key Features
- External services performance monitoring
- Business transaction monitoring
- Detailed dashboards bring data together
- Quick anomaly detection and root cause integration
It partners with dozens of popular SaaS providers, including Azure, AWS, IBM Bluemix, Engine Yard, CloudBees, as well as mobile app backend service providers StackMob, Parse, and Appcelerator.
New Relic is expanding its focus on AI and GenAI observability. Beyond traditional logs, metrics, and traces, it now offers features tailored for LLM and AI applications, such as model comparison, monitoring behavior issues like hallucinations and bias, and tracking costs and token usage.
In 2025, New Relic announced an observability integration for DeepSeek, an open-source AI platform, including support for DeepSeek on Microsoft Azure AI Foundry. The integration enables monitoring of generative AI applications built with DeepSeek, providing visibility into model performance, cost metrics, request tracing, and more.
This marks a major shift, as AI applications bring entirely new observability challenges. As for pricing, you only pay for what you use ($0.30 per Gigabyte). There are no hidden costs, surprise overages, or blind spots from sampling data.
1. Dynatrace
Price: $74 per month for full-stack monitoring | 15-day free trial available
Founded in 2005
Rating: 9/10 from 3,000+ customers
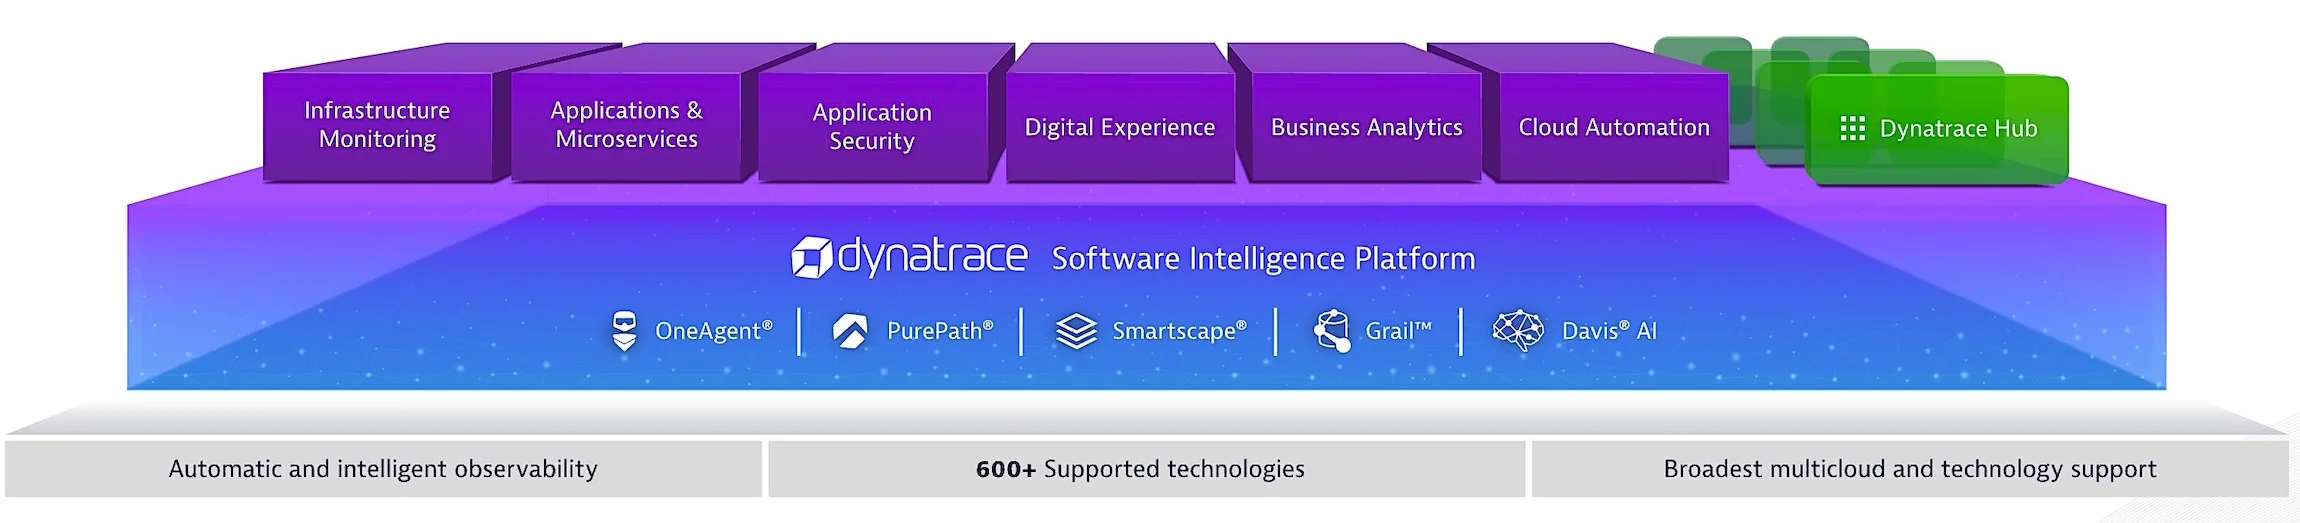
Dynatrace combines advanced AIOps with deep observability and continuous runtime application security to provide accurate answers and intelligent automation from data. This allows businesses to automate and modernize cloud operations and deliver applications more securely while ensuring flawless digital experiences.
The platform can efficiently monitor all infrastructure, including containers, servers, virtual machines, networks, cloud storage, and more. It offers advanced observability across the Platform as a Service (PaaS) and container technologies like OpenShift, Kubernetes, Azure, AWS, and Cloud Foundry.
The Business Analytics tool makes it easy to analyze mobile and web conversions, customer segmentation, and revenue impact. You can pull in additional data from 30+ third-party services, including Google Analytics and Adobe Analytics, to make informed decisions.
Key Benefits
- One-click integration with web analytics
- Offers deep code-level visibility
- Includes 200+ custom metrics per host for technology data integration
- AI assistance with precise root cause determination
The platform seamlessly integrates with more than 620 technologies, including Docker, Java, Prometheus, AWS, Azure, and various open-source frameworks.
While it’s an all-in-one platform, you can purchase individual modules as per your business requirements. For example, the digital experience monitoring system (which starts at $11 per month) helps you to optimize user experiences across IoT devices. The application security system (which costs $15 per month) lets you detect runtime application vulnerabilities and optimize for the cloud and Kubernetes.
In Perform 2025 (their big user/event conference), Dynatrace emphasized a shift toward preventive operations (rather than reactive), strengthening cloud security, embedding observability into developer workflows, and using its AI engine (Davis AI) to recommend operational best practices.
How big is Datadog?
Datadog is headquartered in New York City and operates 11 offices across the United States, 18 in Europe and the Middle East, and 4 in the Asia-Pacific region, employing over 6,500 people.
The company went public in 2019, raising $648 million through the sale of 24 million shares. In FY 2025, it generated $3.01 billion in revenue, a 26% increase year-over-year.
Who uses Datadog?
Datadog serves more than 30,000 clients in different industries, from computing and hardware to finance and real estate. Samsung, Sony, Siemens, Lenovo, The Washington Post, FICO, Asana, Harvard Medical School, Comcast, 21st Century Fox, Whole Foods Market, and Nasdaq are some of its biggest clients.
The Best Network Monitoring Tools
If you are looking for network monitoring platforms to track and manage your devices, these are the best options available in the market:
- SolarWinds Network Performance Monitor
- Atera
- Paessler PRTG Network Monitor
- Site24x7 Network Monitoring
- ManageEngine OpManager
- Domotz
- HelpSystems Intermapper
- Progress WhatsUp Gold
- Nagios XI
What’s the future of AIOps Platforms Look Like?
Artificial Intelligence for IT operations (AIOps) combines human intelligence with automated algorithms to provide a 360-degree view of IT systems. It has become vital for tracing, analyzing, and managing modern IT infrastructures that are componentized, distributed, dynamic, and hybrid.
According to Grand View Research, the AIOps platform market is expected to exceed $36 billion by 2030, growing at a CAGR of 15.2%. North America, particularly the United States, is projected to lead this growth.
Why You Can Trust Us?
We thoroughly analyzed 25 Datadog alternatives and read customers’ reviews. It took more than 24 hours to do the comprehensive research. Finally, we decided to shortlist the 13 platforms based on their features, pricing structure, and ease of use.
Our “Rating” is the average of all ratings given by genuine customers on trusted review websites. In order to show you the true picture, we haven’t considered the reviews and testimonials featured on the product’s official website.
We DO NOT earn commission from any of the featured platforms. Moreover, we have two separate editors who have no influence over our listing criteria or recommendations.
Read More